


Official Supplier
As official and authorized distributors, we supply you with legitimate licenses directly from 200+ software publishers.
See all our Brands.
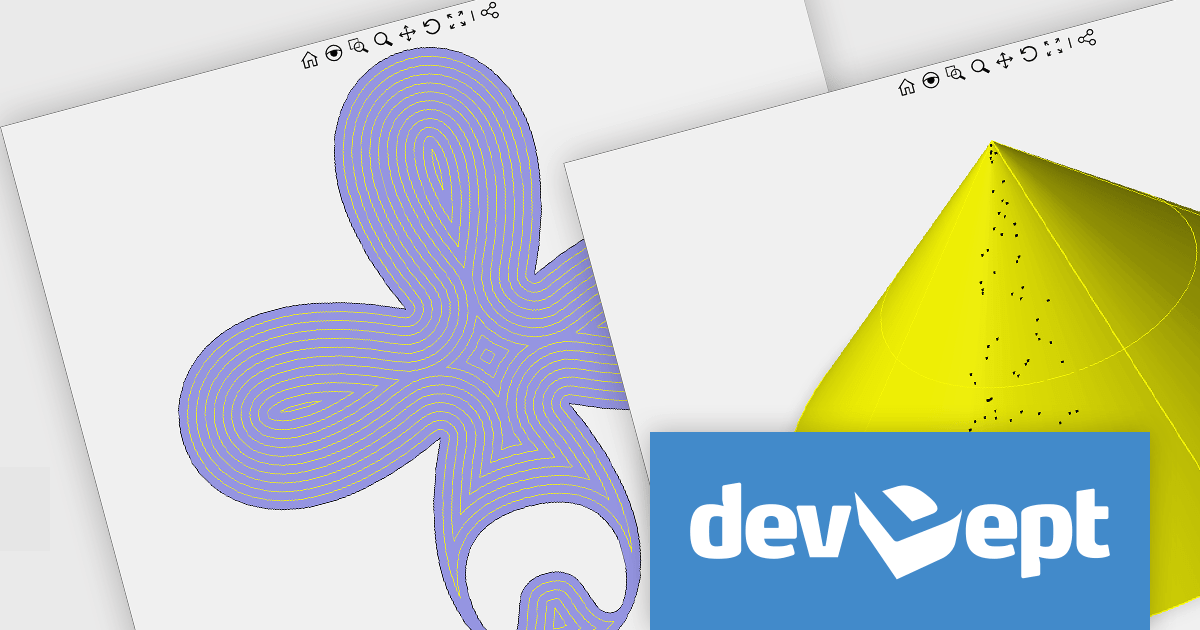
DevDept Software is an award-winning premier Visual Studio Industry Partner and one of the world's largest providers of CAD and 3D Graphics developer components. For over a decade, their Eyeshot components have helped developers add CAD capabilities to their .NET applications. Eyeshot Pro offers polygonal modeling, drafting, and point cloud. Eyeshot Ultimate expands on this functionality to include NURBS and BRep modeling, IGES/STEP and CAM. Eyeshot Fem adds geometry meshing and Finite Element Analysis.
In this blog post, devDept's Alberto Bencivenni takes you through the new and enhanced features included in the Eyeshot 2025 Beta. This includes links to videos demonstrating the various features and tools.
Read the full blog for more details on the new and updated features in Eyeshot 2025 Beta.
As a supplement to this Beta release, devDept have created a Migration Guide to assist you in migrating your Eyeshot 2024 projects to Eyeshot 2025. Like the Eyeshot 2025 Beta, this migration guide is a work in progress and will be updated as changes are made to the beta as it progresses towards its official release. It includes steps to upgrade individual projects and even shows you how to use the Project Converter tool to migrate multiple projects in a batch.
To explore the devDept product range, visit our devDept brand page.
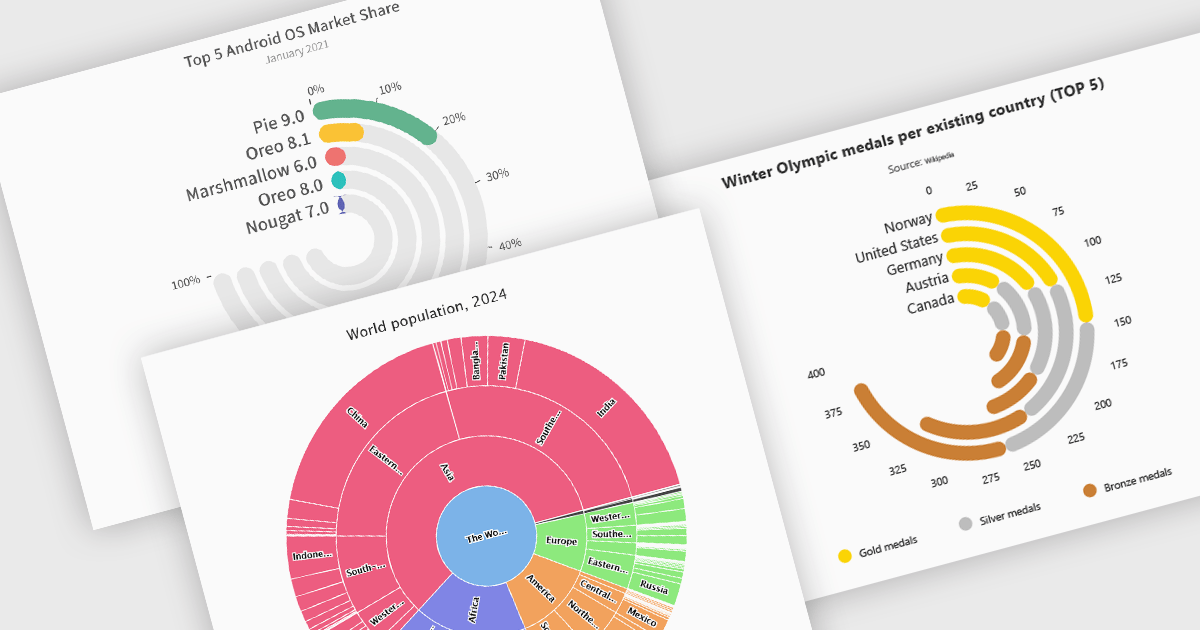
Radial charts provide an intuitive way to visualize hierarchical and categorical data. They display bars on a polar coordinate system instead of a cartesian system, which uses an x-y grid for positioning data. These charts represent values in a circular layout, making it ideal for comparing proportions and relationships between data points. Circular bar charts, a variation of the traditional bar chart, arrange data in a radial format for displaying comparisons between categories. They are particularly useful for visualizing periodic or cyclical data, such as time-based metrics. Sunburst charts break down hierarchical structures into concentric rings. The center of the chart typically represents the root category, while outer rings depict subcategories. These are used for visualizing part-to-whole relationships within a dataset. Many .NET charting components support these visualization types, allowing developers to create dynamic, interactive, and visually appealing dashboards in .NET applications.
Several .NET charting components provide you with radial charts, including:
For an in-depth analysis of features and price, visit our .NET chart components comparison.

Rich text editors for WinForms let users create and format content in a familiar, word processor-like environment. These editors support advanced text styling, media embedding, and customizable toolbars, giving developers flexibility to build feature-rich desktop applications. With features like document import/export, content validation, and extensive formatting controls, they enhance the user experience while ensuring consistency across applications. Designed for accessibility and optimized for desktop performance, they integrate seamlessly into Windows-based workflows.
Several .NET WinForms UI suites offer rich text editors including:
For an in-depth analysis of features and price, visit our comparison of .NET WinForms UI Suites:

Syncfusion Essential Studio Windows Forms (available as part of Syncfusion Essential Studio Enterprise) is a powerful UI component suite designed to enhance your WinForms development. It boasts over 100 high-performance controls, ranging from essential grids and charts to advanced schedulers and diagrams, enabling you to craft visually appealing and feature-rich applications with ease. Its extensive customization options and built-in themes allow for tailored user experiences, while touch-friendly design ensures seamless interaction across devices.
The Syncfusion Essential Studio Windows Forms 2024 Volume 4 update introduces advanced JavaScript integration capabilities within its PDF Library, empowering developers to add, retrieve, modify, and remove JavaScript actions at the document level. This enhancement enables the creation of dynamic and interactive PDF experiences, such as automated form handling, custom behaviors, and real-time content updates, directly within the application. By supporting ECMAScript, this feature ensures compatibility with industry-standard scripting practices, streamlining workflows and offering greater flexibility for tailoring PDFs to meet specific user and business requirements.
To see a full list of what's new in 2024 Volume 4, see our release notes.
Syncfusion Essential Studio Windows Forms is available as part of Syncfusion Essential Studio Enterprise which is licensed per developer starting with a Team License of up to five developers. It is available as a 12 Month Timed Subscription License which includes support and maintenance. See our Syncfusion Essential Studio Enterprise licensing page for full details.
Learn more on our Syncfusion Essential Studio Windows Forms product page.
ComponentSource and EPPlus Software have enjoyed a successful three-year partnership, dedicated to providing high-quality tools to developers around the world. This collaboration reflects their shared mission to empower developers with innovative solutions that boost productivity and support the creation of reliable, high-performance applications.
EPPlus Software is the creator of EPPlus, a widely used .NET library for managing Office Open XML spreadsheets. Offering advanced features such as styling, charts, formulas, and pivot tables, it simplifies data processing and reporting. By adopting EPPlus, organizations can streamline spreadsheet-driven workflows, improve accuracy, and reduce costs.
As a leading distributor of software components and development tools, ComponentSource has helped to expand EPPlus Software’s global reach. This collaboration has brought tangible benefits to the developer community, making cutting-edge spreadsheet tools readily available. As we celebrate this three-year milestone, we look forward to strengthening our partnership and continuing to deliver innovative solutions that drive developer success on a global scale.
Learn more about EPPlus Software.


Tel: (888) 850 9911
Fax: +1 770 250 6199


