


Official Supplier
As official and authorized distributors, we supply you with legitimate licenses directly from 200+ software publishers.
See all our Brands.
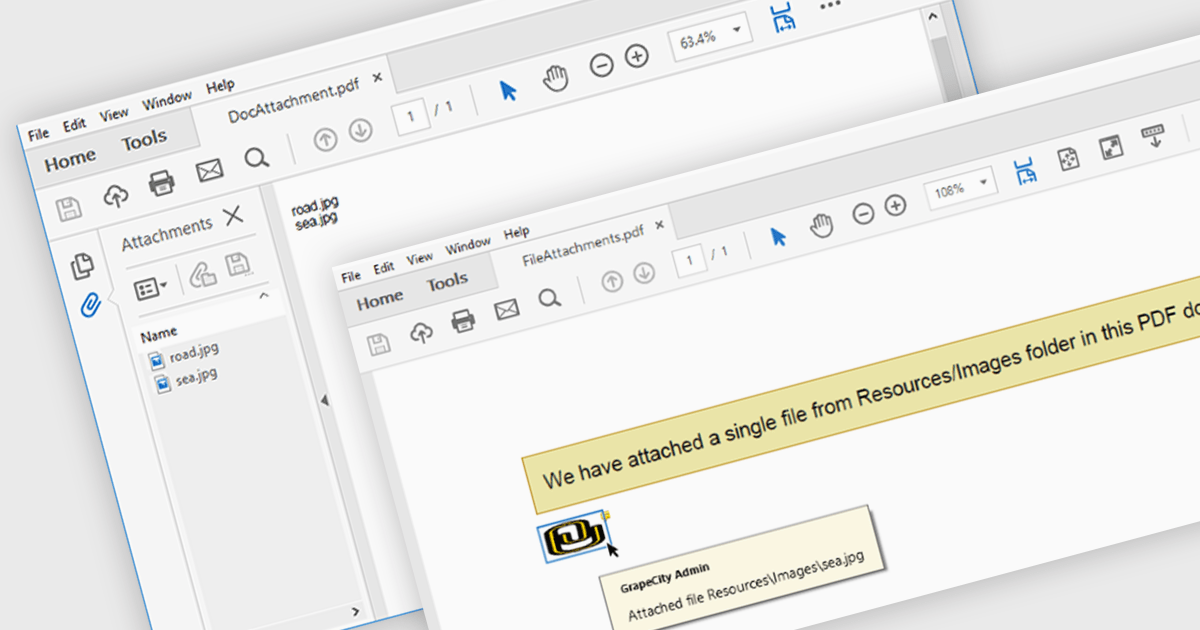
The ability to attach files to a PDF enables seamless integration of supplementary documents directly into the primary PDF file. This functionality streamlines workflows by consolidating related materials into a single, easily accessible package. Developers can leverage this feature to enhance document organization, improve collaboration, and provide a more comprehensive user experience.
Several .NET PDF components offer support for attaching files to a PDF including:
For an in-depth analysis of features and price, visit our comparison of .NET PDF components.
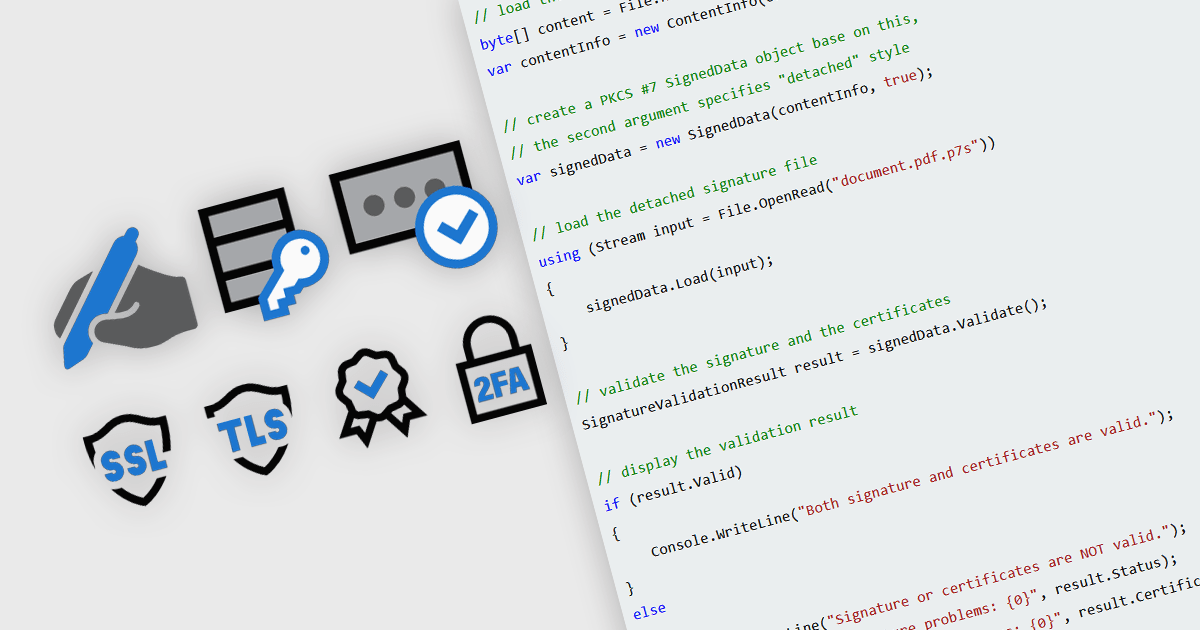
In modern communications and messaging platforms, security features are essential for safeguarding data integrity, user privacy, and system reliability. These features encompass a range of protocols and mechanisms designed to protect data from unauthorized access, ensure data authenticity, and verify the identity of communicating parties. By integrating security measures such as encryption, authentication, and digital certificates, organizations can mitigate risks and enhance trust within their digital ecosystems. Effective security within messaging and communication systems not only prevents data breaches but also ensures compliance with regulatory standards and supports secure collaboration across teams and partners.
Common features include:
For an in-depth analysis of features and price, visit our .NET communications and messaging components comparison.
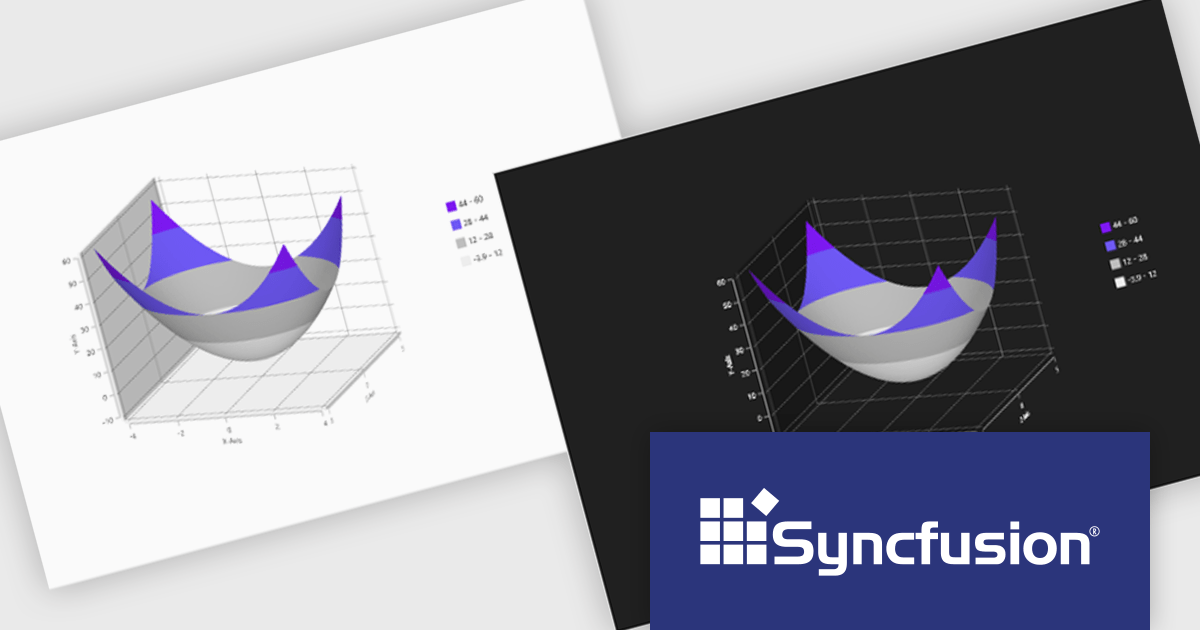
Syncfusion Essential Studio WPF, available as part of Syncfusion Essential Studio Enterprise, is a powerful suite of over 95 UI controls, 50+ charts, and document processing libraries designed to boost the development of high-performance line-of-business applications for the Windows Presentation Foundation (WPF) framework. With built-in themes, touch-friendly interfaces, and seamless Visual Studio integration, it empowers developers to craft modern, feature-rich, and cross-platform experiences with ease.
The Syncfusion Essential Studio WPF 2024 Volume 3 release adds theming support to the Surface Chart. By enabling the modification of color palettes, font styles, axis labels, and overall layout, theming empowers users to create visually striking and informative charts that align with specific branding guidelines or user preferences. This flexibility not only improves the chart's aesthetic quality but also contributes to a more engaging and intuitive user experience.
To see a full list of what's new in 2024 Volume 3, see our release notes.
Syncfusion Essential Studio WPF is available as part of Syncfusion Essential Studio Enterprise which is licensed per developer starting with a Team License of up to five developers. It is available as a 12 Month Timed Subscription License which includes support and maintenance. See our Syncfusion Essential Studio Enterprise licensing page for full details.
Learn more on our Syncfusion Essential Studio WPF product page.

To better align with the evolving landscape of reporting technologies, Fast Reports will cease updates and support for FastReport.Web (.NET Framework) on December 1st. While this library has been invaluable for numerous Online Designer projects, FastReports' future efforts will concentrate on more modern technologies. From this date, the FastReport.Web (Legacy) library will no longer receive bug fixes or technical support.
Fast Reports currently supports four web reporting solutions:
You can still create an Online Designer for FastReport.Web (Legacy), but Fast Reports recommends migrating to the new backend for an improved user experience.
FastReport .NET includes both backends, so no further purchase is necessary. To migrate to FastReport.Web for Core/Blazor, you will need to build an Online Designer with the updated FastReport.Web or FastReport.Web.Skia backend.
FastReport .NET is licensed per named user with options for Single, Team or Site Licenses. See our FastReport .NET licensing page for full details.
For more information, visit our FastReport .NET product page.
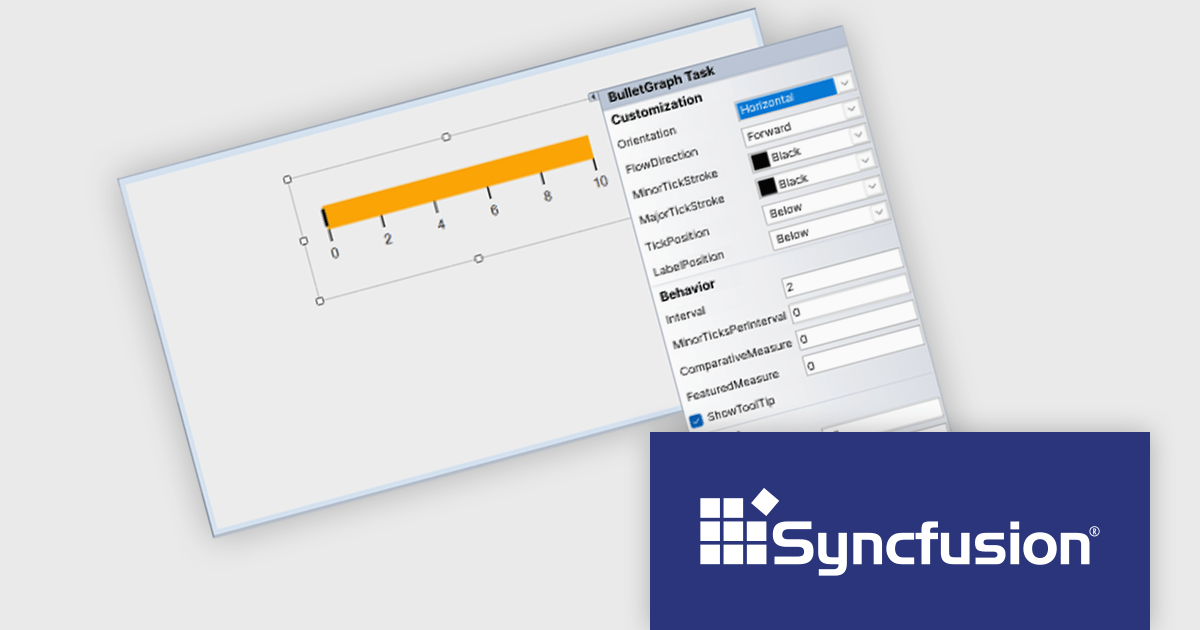
Syncfusion Essential Studio Windows Forms is a powerful UI component suite designed to enhance your WinForms development. It boasts over 100 high-performance controls, ranging from essential grids and charts to advanced schedulers and diagrams, enabling you to craft visually appealing and feature-rich applications with ease. Its extensive customization options and built-in themes allow for tailored user experiences, while touch-friendly design ensures seamless interaction across devices.
The Syncfusion Essential Studio Windows Forms 2024 Volume 3 release adds smart tag support to the BulletGraph control. Smart tags provide quick access to common properties and settings directly within the design view, eliminating the need for manual property adjustments. This approach accelerates development time and reduces the risk of errors, empowering developers to create visually compelling and informative BulletGraphs with greater efficiency.
To see a full list of what's new in 2024 Volume 3, see our release notes.
Syncfusion Essential Studio Windows Forms is available as part of Syncfusion Essential Studio Enterprise which is licensed per developer starting with a Team License of up to five developers. It is available as a 12 Month Timed Subscription License which includes support and maintenance. See our Syncfusion Essential Studio Enterprise licensing page for full details.
Learn more on our Syncfusion Essential Studio Windows Forms product page.


Tel: (888) 850 9911
Fax: +1 770 250 6199


