








Official Supplier
As official and authorized distributors, we supply you with legitimate licenses directly from 200+ software publishers.
See all our Brands.
FastReport .NET Ultimate is a comprehensive reporting solution for developers working within the Microsoft .NET ecosystem. It supports the creation, design, and delivery of rich, interactive reports across Windows Forms, ASP.NET, MVC, and .NET Core applications. The Ultimate edition includes server deployment capabilities and extensive export options, such as PDF, Excel, Word, and HTML. It connects to various data sources, including SQL databases and business objects, providing flexibility for enterprise-level reporting. With the integrated FastReport Online Designer, users can edit reports directly in their browsers, enabling efficient collaboration and modern, full-featured report design across both desktop and web platforms.
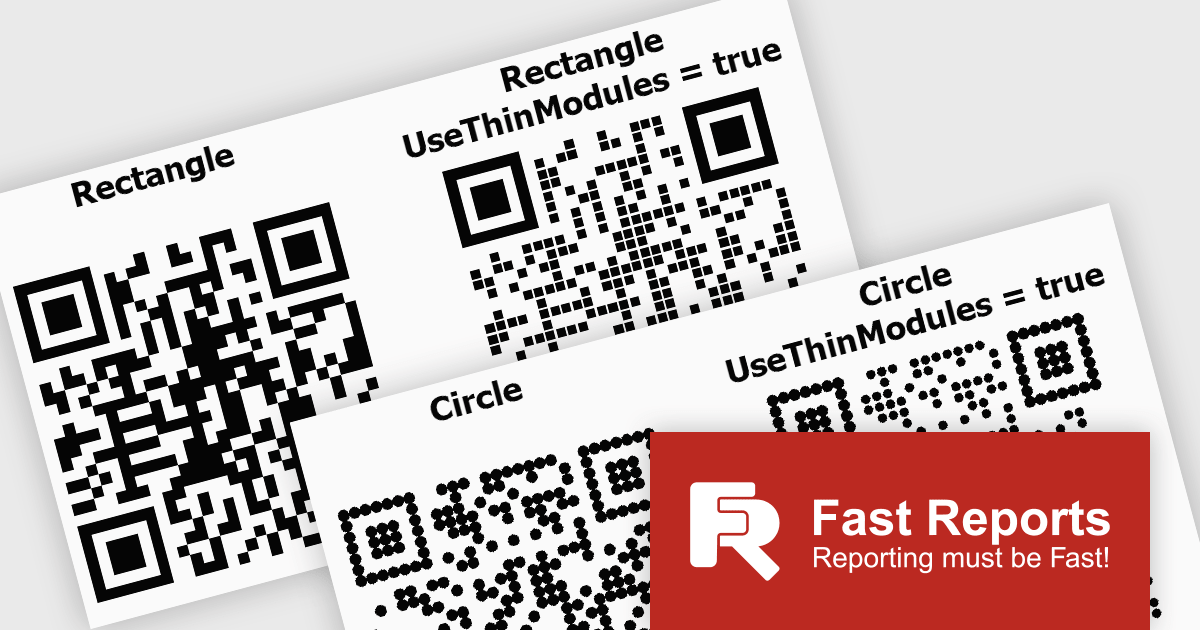
FastReport .NET Ultimate offers developers flexibility when generating QR codes, making it easier to adapt their appearance to different applications, reports, and branding requirements. By supporting a wider range of visual styles directly within the reporting engine, it enables teams to create QR codes that integrate more naturally into user interfaces, printed documents, dashboards, and customer facing materials. This helps produce more polished and professional output while maintaining compatibility, readability, and reliable scanning across standard QR code readers and devices.
FastReport .NET Ultimate is licensed per named user and is available as a perpetual license with a one-year subscription for updates and support. See our FastReport .NET Ultimate licensing page for full details.
For more information, visit our FastReport .NET Ultimate product page.
LEADTOOLS Recognition SDK is a software development toolkit designed for building applications that extract data from images and documents. It empowers developers with features like Optical Character Recognition (OCR) for converting scanned documents to text, barcode reading, and form processing. Additionally, it offers functionalities for handling various file formats, image pre-processing, and document viewing, making it a comprehensive solution for automating document workflows in enterprises and organizations.
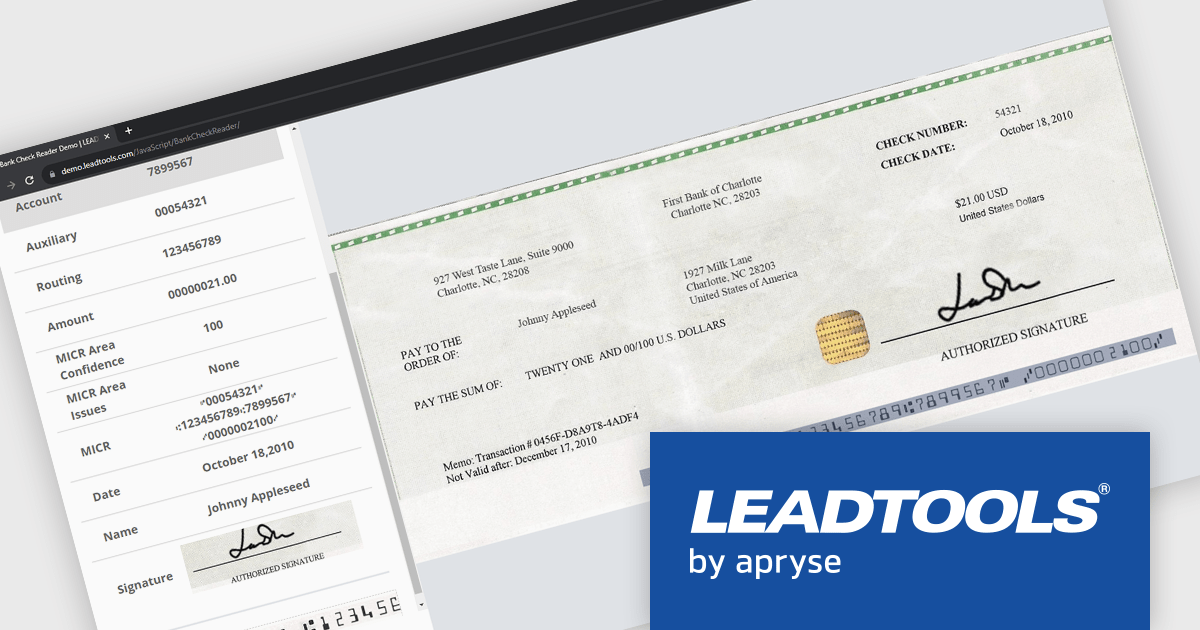
LEADTOOLS Recognition SDK enables developers to automatically read and parse MICR data from checks, extracting routing, account, and check numbers with high accuracy. This capability helps streamline check processing workflows, reduce manual data entry, minimize errors, and accelerate the integration of financial document capture into banking, payment, and accounts processing applications.
LEADTOOLS Recognition SDK is licensed as Development Licenses, for developers to use the SDKs, and Deployment Licenses, for the right to distribute end user solutions. See our LEADTOOLS Recognition SDK licensing page for full details.
Learn more on our LEADTOOLS Recognition SDK product page.
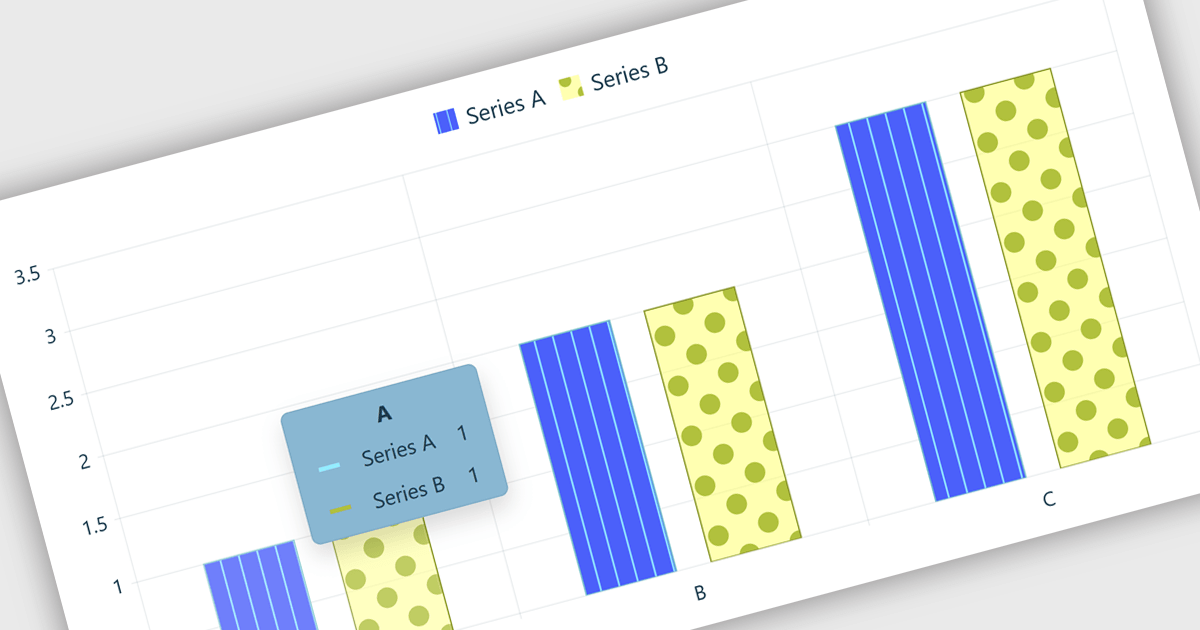
Chart tooltips in a charting component are interactive elements that display additional information about data points when users hover over or interact with a chart. They help software developers enhance data visualizations by providing detailed values, contextual insights, and comparisons on demand without cluttering the chart itself, improving usability, supporting more effective data analysis, and creating a more engaging user experience.
Several React chart controls offer tooltip support including:
For an in-depth analysis of features and price, visit our React chart controls comparison:
ZingGrid is a JavaScript library that simplifies the creation of interactive data tables and grids within web applications. Utilizing modern web components and focusing on performance and responsiveness, ZingGrid allows developers to implement features like searching, filtering, pagination, and in-line editing with minimal coding. This empowers efficient data visualization and manipulation for users, making it a valuable tool for web development.
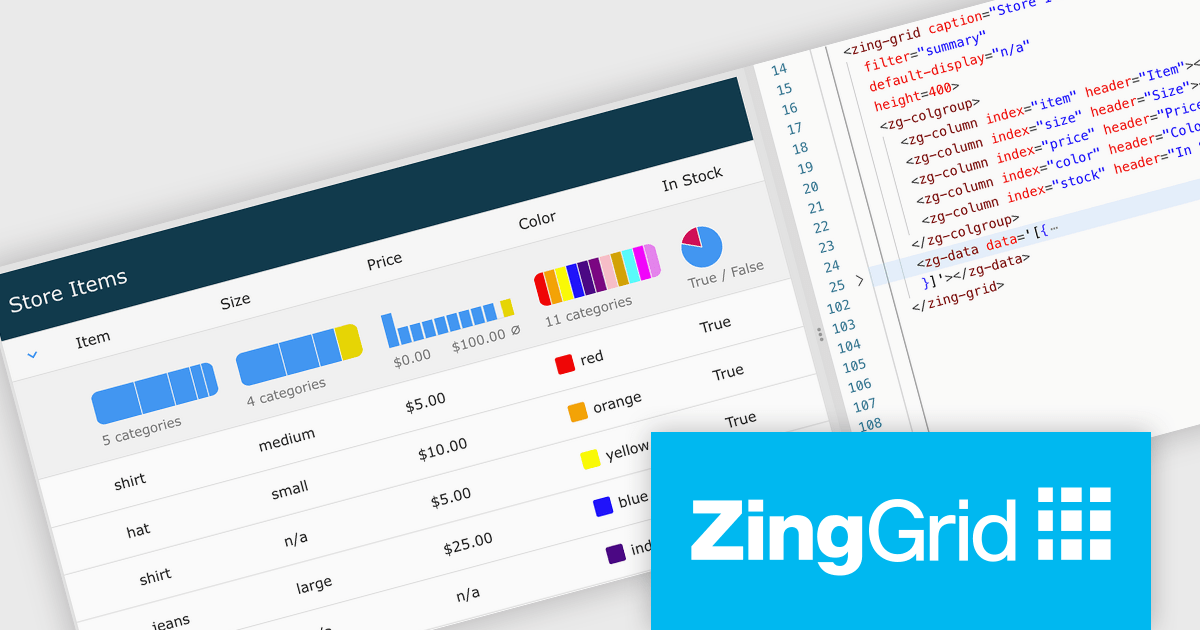
The ZingGrid 2.2.0 update introduces a Filter Summary Chart that enables users to visually explore and filter data through an interactive chart interface, making it easier to identify patterns, trends, and distributions within large datasets. By combining data visualization with filtering functionality, the feature helps users refine results more intuitively and efficiently than traditional filter controls, while allowing developers to quickly add this capability at either the grid or column level with minimal configuration.
To see a full list of what's new in version 2.2.0, see our release notes.
ZingGrid is available as either a Single-Domain Website or Multi-Domain SaaS license. See our ZingGrid licensing page for full details.
For more information, visit our ZingGrid product page.
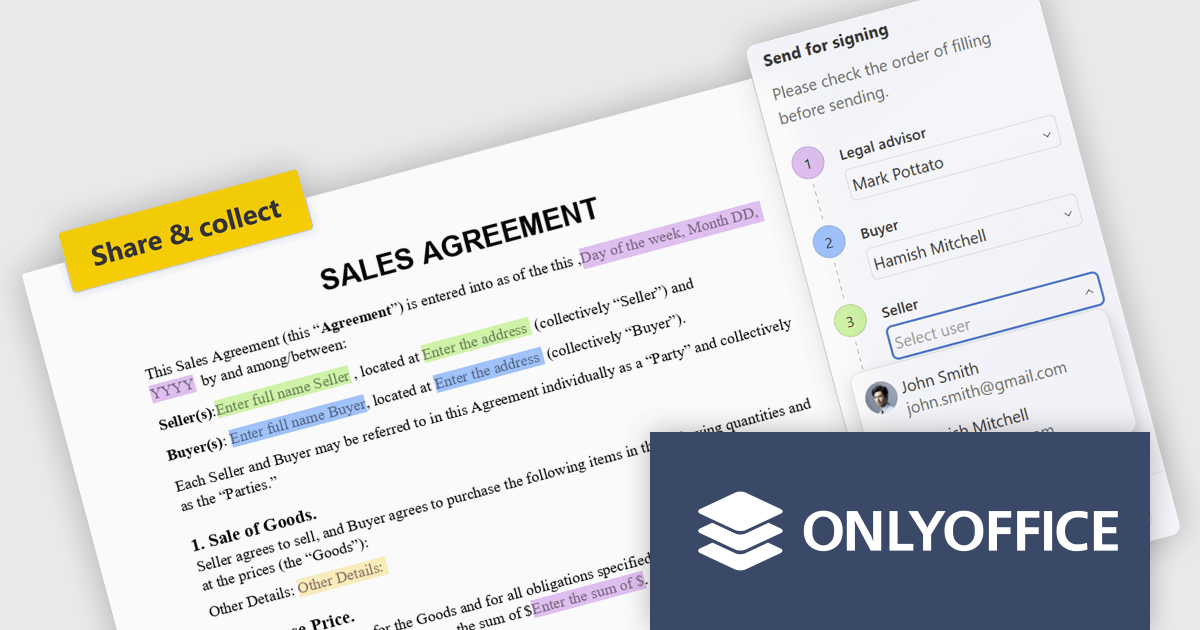
ONLYOFFICE Docs is a comprehensive online editor, allowing users to create text documents, spreadsheets, presentations, and forms. It enables your users to edit, share, and collaborate on documents online in their preferred browser, within your own application. It is fully compatible with OOXML (Office Open XML) formats and supports popular Microsoft Office and other document formats such as CSV, DOC, DOCX, EPUB, HTML, ODP, ODS, ODT, PDF, PPT, PPTX, RTF, TXT, XLS, and XLSX.
The ONLYOFFICE Docs 9.4 update introduces built in recipient assignment and filling status tracking directly within the editor, allowing developers and teams to manage form workflows more efficiently without relying on separate tools or administrative steps. By centralizing recipient management and completion monitoring in a single interface, the feature provides greater visibility into form progress, reduces context switching, and simplifies workflow coordination. This helps improve document driven processes, improves productivity, and enables faster tracking and follow up of outstanding form actions.
To see a full list of what's new in v9.4, see our release notes.
ONLYOFFICE Docs Developer Edition is licensed by the number of simultaneous document connections and is available as an annual license with 1 year support and upgrades. See our ONLYOFFICE Docs Developer Edition licensing page for full details.
For more information, see our ONLYOFFICE Docs Developer Edition product page.





Tel: (888) 850 9911
Fax: +1 770 250 6199


