








Official Supplier
As official and authorized distributors, we supply you with legitimate licenses directly from 200+ software publishers.
See all our Brands.
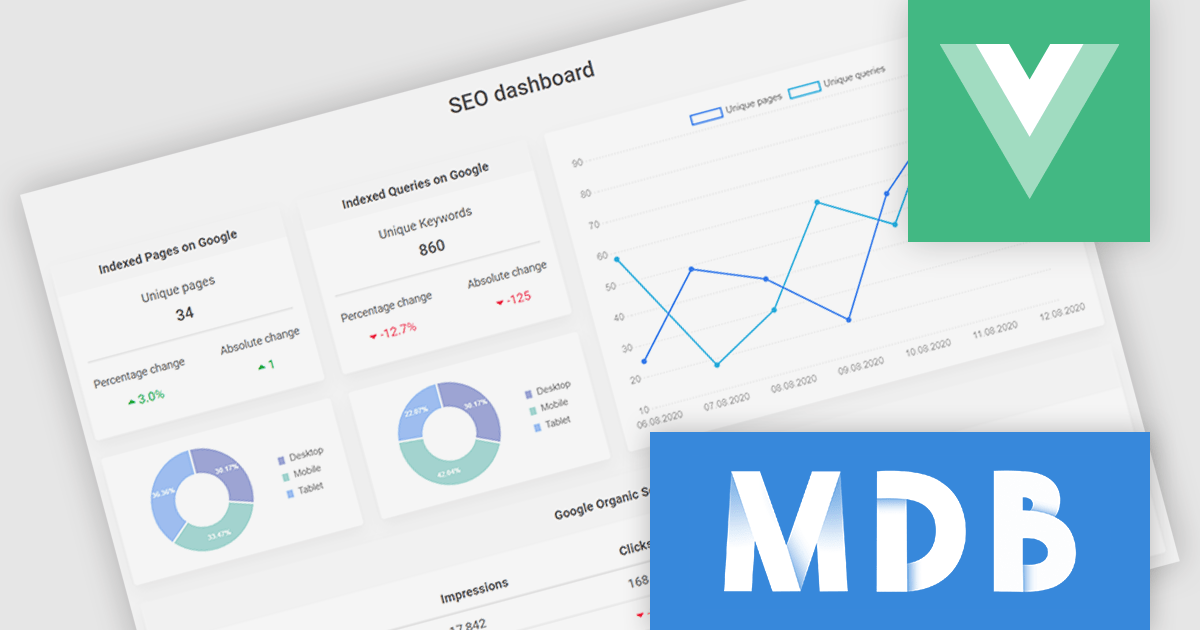
MDB Pro Vue by MDBootstrap is a premium front-end UI toolkit designed for Vue.js, offering a comprehensive collection of over 5,000 components, templates and plug-ins such as charts and advanced forms, to create responsive and visually appealing interfaces. With built-in design consistency, customization options, and seamless integration with Vue.js, MDB Pro Vue enables developers to build professional-grade web applications efficiently. Ideal for e-commerce sites, dashboards, and corporate projects, it empowers teams to enhance user experience while saving time and development costs.
MDB Pro Vue provides responsive, interactive, and customizable charts, enabling effective data visualization across various use cases. It offers an extensive range of chart types to suit diverse requirements, including bar and line charts for trends, pie and donut charts for proportions, polar area charts for variations in magnitude, and radar charts for multivariate data. Bubble charts add depth with size-based values, while scatter plots visualize data relationships. Fully customizable with options for colors, labels, tooltips, and animations, these charts integrate seamlessly into any design. Ideal for dashboards, analytics tools, and reporting interfaces, they deliver a polished, engaging user experience.
MDB Pro Vue is licensed per developer, per project/domain with packages for individual developers, development teams and Enterprises. See our MDB Pro Vue licensing page for full details.
MDB Pro Vue is available individually or as part of MDB Pro Bundle.

Stimulsoft Dashboards.PHP is a powerful dashboarding and reporting tool designed for PHP web applications. It enables developers to create interactive and visually appealing dashboards that provide real-time insights into data. With its intuitive interface and extensive features, Stimulsoft Dashboards.PHP empowers users to analyze complex data sets, visualize trends, and make data-driven decisions effectively.
The Stimulsoft Dashboards.PHP 2025.1.1 update introduces customizable axis titles for 3D charts, providing users with greater control over data presentation. This enhancement enables the addition of clear and descriptive labels to the X and Y axes, improving the readability and interpretability of complex data visualizations. With the new Title property group located under Area > X-Axis or Y-Axis > Title, users can easily configure and align axis titles to meet specific design and user experience requirements. This feature ensures a more professional and user-friendly approach to presenting multidimensional data within dashboards.
To see a full list of what's new in 2025.1.1, see our release notes.
Stimulsoft Dashboards.PHP is licensed per developer and is available as a perpetual license with 1 year support and maintenance. See our Stimulsoft Dashboards.PHP licensing page for full details.
Stimulsoft Dashboards.PHP is available individually or as part of Stimulsoft Ultimate.
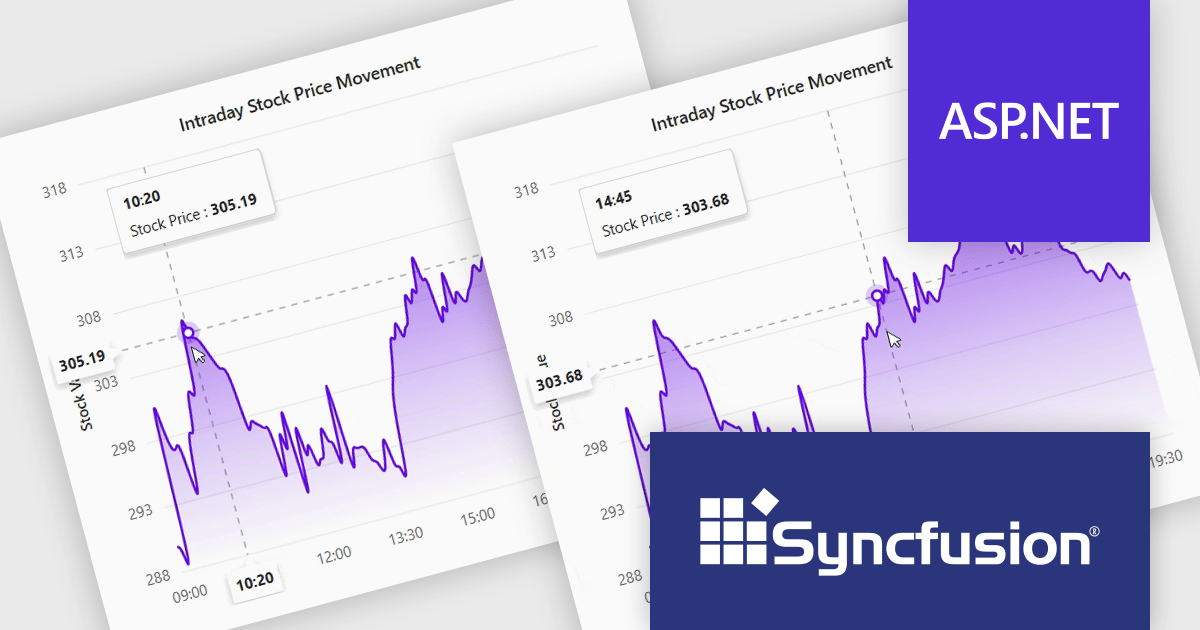
Syncfusion Essential Studio ASP.NET MVC (available as part of Syncfusion Essential Studio Enterprise) is a comprehensive suite of web UI controls that empowers developers to craft rich, interactive ASP.NET MVC applications. Backed by the lightweight and modular Essential JS 2 library, it offers over 80 components ranging from data grids and charts to schedulers and pivot grids, while ensuring a seamless integration with the MVC framework for an efficient development experience.
The Syncfusion Essential Studio ASP.NET MVC 2024 Volume 4 (28.1.33) update introduces the Crosshair Snap feature to its charting tools, delivering enhanced precision and usability for developers. This feature ensures the crosshair automatically snaps to the nearest data point, eliminating the need for users to align the cursor with exact positions manually. By streamlining interaction with charts, the Crosshair Snap simplifies the analysis of complex datasets and improves the clarity of data visualization. This addition not only optimizes the end-user experience but also provides developers with a powerful tool to create more intuitive and efficient applications.
To see a full list of what's new in 2024 Volume 4, see our release notes.
Syncfusion Essential Studio ASP.NET MVC is available as part of Syncfusion Essential Studio Enterprise which is licensed per developer starting with a Team License of up to five developers. It is available as a 12 Month Timed Subscription License which includes support and maintenance. See our Syncfusion Essential Studio Enterprise licensing page for full details.
Learn more on our Syncfusion Essential Studio ASP.NET MVC product page.
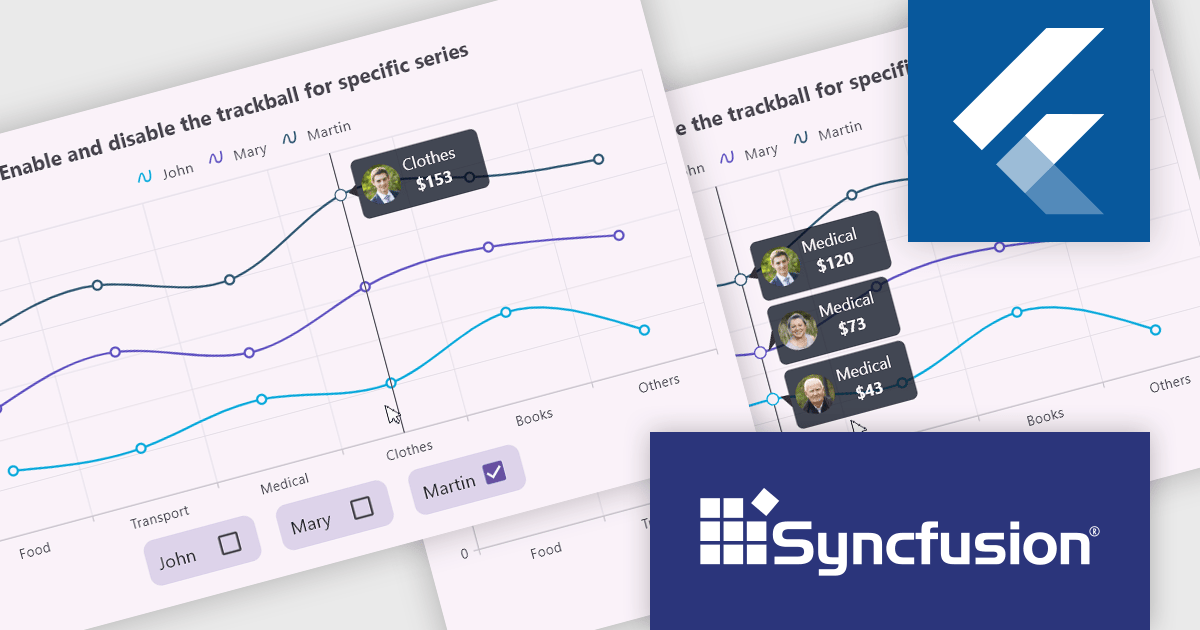
Syncfusion Essential Studio Flutter (available as part of Syncfusion Essential Studio Enterprise) is a powerful UI toolkit that enables you to build beautiful and performant mobile apps for Android and iOS using Flutter. It provides a rich suite of pre-built widgets for common design elements like charts, data grids, calendars, and PDF viewers. These widgets are highly customizable and allow you to quickly implement stunning visuals and advanced functionalities without spending time on repetitive coding.
The Syncfusion Essential Studio Flutter 2024 Volume 4 update introduces the ability to activate or deactivate the trackball for individual chart series, offering developers enhanced control over data visualization. This feature allows for precise data tracking by focusing the trackball on specific series, improving the clarity and relevance of user interactions within complex datasets. By enabling developers to customize the trackball behavior, this update supports a more tailored and efficient user experience, making it easier to highlight critical data points while minimizing visual clutter in multi-series charts.
To see a full list of what's new in 2024 Volume 4, see our release notes.
Syncfusion Essential Studio Flutter is available as part of Syncfusion Essential Studio Enterprise which is licensed per developer starting with a Team License of up to five developers. It is available as a 12 Month Timed Subscription License which includes support and maintenance. See our Syncfusion Essential Studio Enterprise licensing page for full details.
Learn more on our Syncfusion Essential Studio Flutter product page.
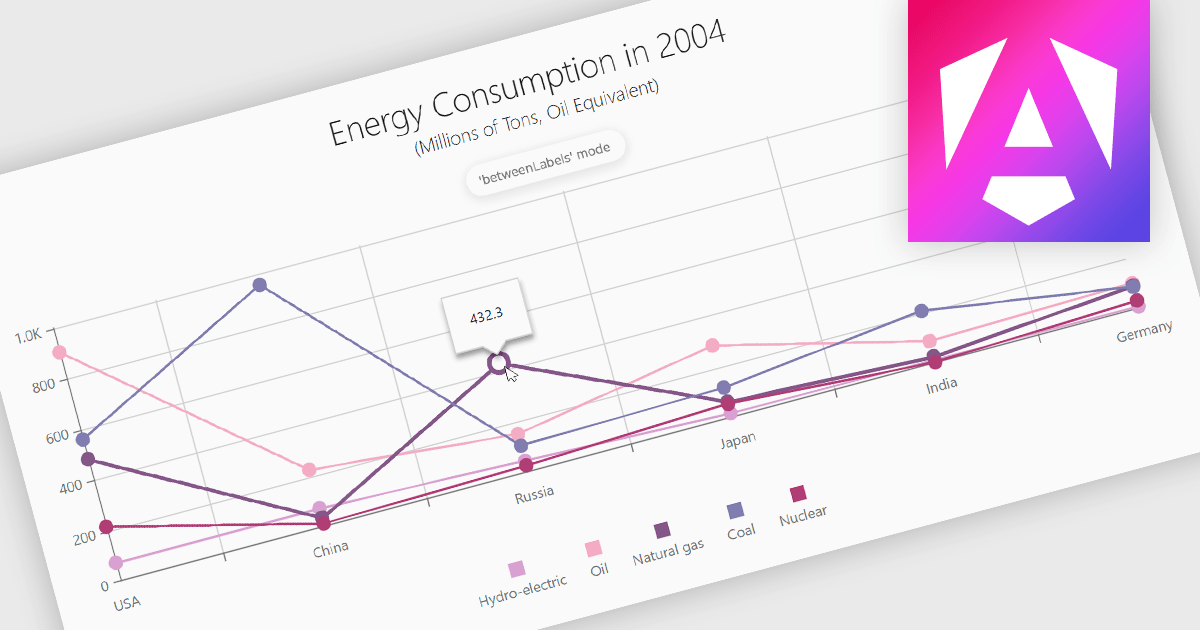
Line charts are a fundamental data visualization tool used to represent quantitative values over a continuous interval, such as time, by connecting data points with straight lines. They are particularly effective for analyzing trends, comparing multiple data sets, and identifying relationships or patterns within large or complex datasets. For software developers, line charts provide a clear and efficient way to present dynamic data, support interactive features for deeper analysis, and enhance decision-making by making critical insights easily accessible through a customizable and intuitive format.
Several Angular chart controls offer line charts including:
For an in-depth analysis of features and price, visit our comparison of Angular Charts.





Tel: (888) 850 9911
Fax: +1 770 250 6199


