


Official Supplier
As official and authorized distributors, we supply you with legitimate licenses directly from 200+ software publishers.
See all our Brands.
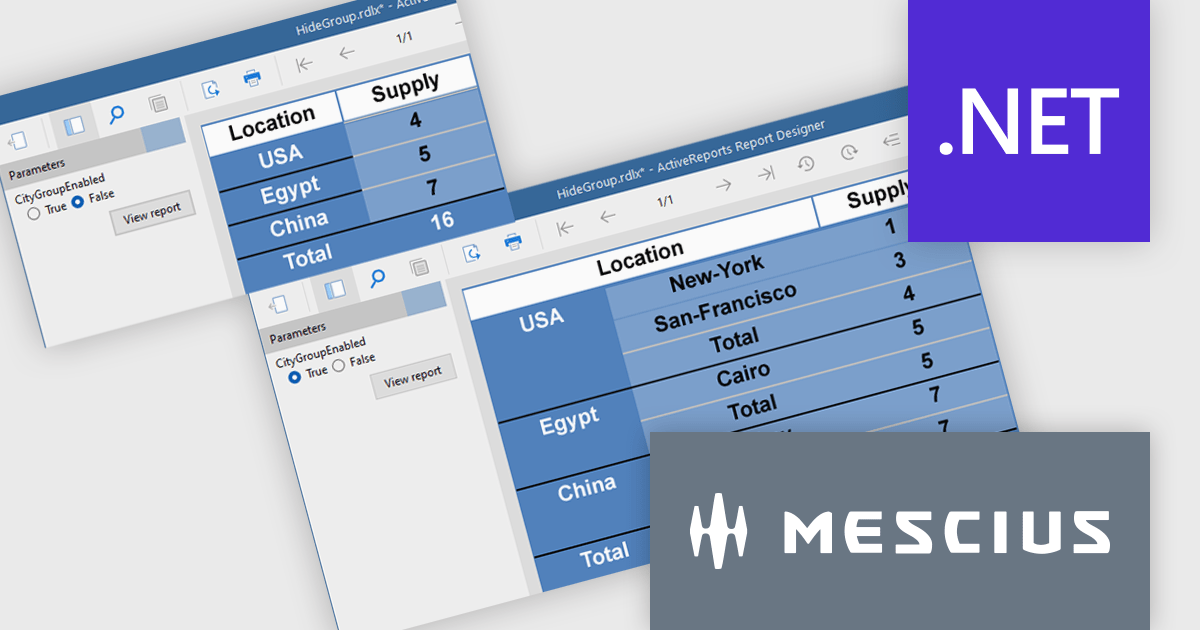
ActiveReports.NET from MESCIUS, is a comprehensive reporting solution for developers building applications in .NET. It empowers you to design and deliver visually appealing reports through user-friendly designers and a wide range of controls. ActiveReports simplifies report creation and distribution with a versatile API, rich data source connectivity, and support for multiple export formats. This translates to increased developer productivity and improved end-user experience with powerful reporting functionalities within your .NET applications.
The ActiveReports v19.1 update introduces enhanced grouping control that allows developers to enable or hide groups in Tables, BandedLists, and Tablix controls based on expressions or parameters. This capability makes it easier to design reports that adapt at runtime to different data scenarios or user inputs, without requiring code changes. By configuring the new "Enabled" and "Hidden" properties directly within the report definition, developers can deliver more flexible and maintainable reporting solutions that respond dynamically to business logic.
To see a full list of what's new in v19.1, see our release notes.
ActiveReports.NET is licensed per developer and is available with or without a 12 month support and maintenance subscription. See our ActiveReports.NET licensing page for full details.
Learn more on our ActiveReports.NET product page.

3DBrowser Pro by Mootools Software is a robust file explorer tailored for managing 3D assets across diverse formats like FBX, GLTF, SketchUp, and Wavefront. It equips artists, designers, and developers with tools to organize, preview, and convert 3D data efficiently. With its intuitive interface and broad compatibility, 3DBrowser Pro supports smooth asset handling—from quick browsing and detailed inspections to maintaining structured libraries—making it a versatile solution for 3D content workflows.
3DBrowser Pro features a real-time rendering engine that highlights fine surface details and simulates realistic lighting directly within its built-in viewer. This advanced visualization enables developers to assess depth, texture, and shading with high fidelity, eliminating the need for external rendering tools. By delivering accurate previews of 3D assets, the software improves the quality of asset validation and supports more confident decision-making throughout the development process.
3DBrowser Pro is licensed per workstation and is available as a perpetual or subscription license. Visit our 3DBrowser Pro Licensing page for full details.
Learn more on our 3DBrowser Pro product page.
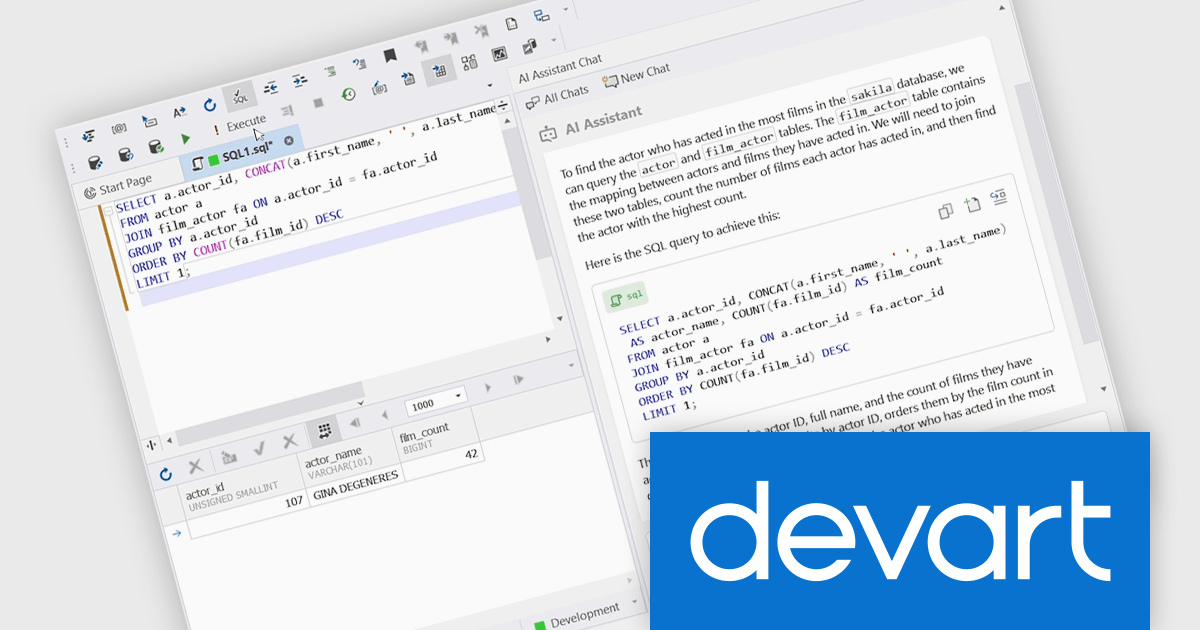
dbForge Studio for SQL Server is a comprehensive SQL Server management tool designed to enhance productivity and efficiency for database professionals. It offers a rich feature set including SQL editing and debugging, database schema design, data comparison and synchronization, performance optimization tools, and integration with source control systems. This software empowers developers and administrators to manage their SQL Server databases effectively, streamline development processes, and ensure data integrity.
dbForge Studio for SQL Server enhances its capabilities with the new dbForge AI Assistant add-on, enabling developers to convert natural language input into accurate SQL queries. This feature improves the query-building process by allowing users to describe their data needs in plain language, which the Assistant then interprets and translates into executable SQL. It significantly reduces the time spent on manual query writing, minimizes syntax errors, and accelerates access to data, especially in complex databases. Designed to support both experienced developers and those less familiar with SQL syntax, the AI Assistant improves productivity and simplifies database interaction within the familiar dbForge environment.
To see a full list of what's new in V2025.1.124, see our release notes.
dbForge Studio for SQL Server is licensed per developer and is available as an Annual or Perpetual License with a 12 month support and maintenance subscription. See our dbForge Studio for SQL Server licensing page for full details.
dbForge Studio for SQL Server is available in the following products:
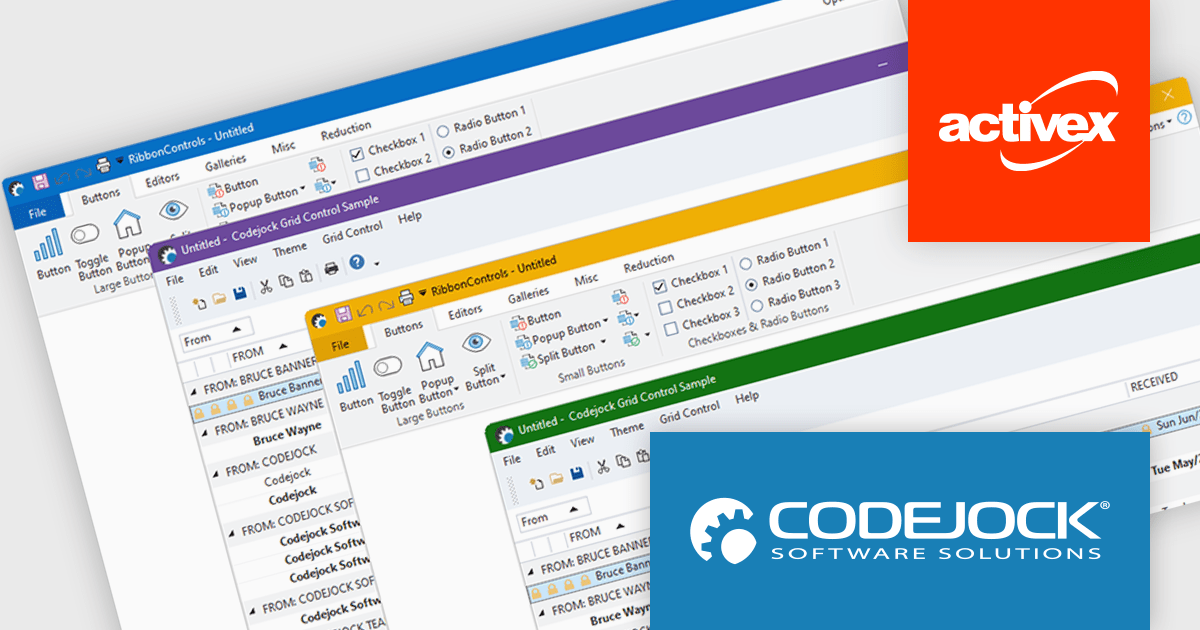
Codejock Suite Pro is a comprehensive collection of UI components and libraries designed to enhance the development process and create visually stunning applications. With a rich array of features including grids, charts, editors, docking windows and more, the suite empowers developers to rapidly build robust and user-friendly interfaces. Whether you're building enterprise applications, data visualization tools or custom user interfaces, Codejock Suite Pro provides the essential tools to elevate your projects and deliver exceptional user experiences.
The Codejock Suite Pro 24.2.0 release brings full support for Windows 11's visual styling, allowing toolbar and ribbon components to adopt both system-defined and user-custom accent colors. This enhancement ensures that applications built with Codejock controls visually align with the modern Windows 11 interface, delivering a more integrated and polished look. Developers can now create interfaces that feel native on Windows 11, helping end users enjoy a cohesive experience across both system and application elements.
To see a full list of what's new in the 24.2.0 release, see our release notes.
Codejock Suite Pro is licensed per developer and is available as a perpetual license with 30 days or 1 year subscription (product updates and phone/email technical support). See our Codejock Suite Pro licensing page for full details.
For more information, visit our Codejock Suite Pro product page.
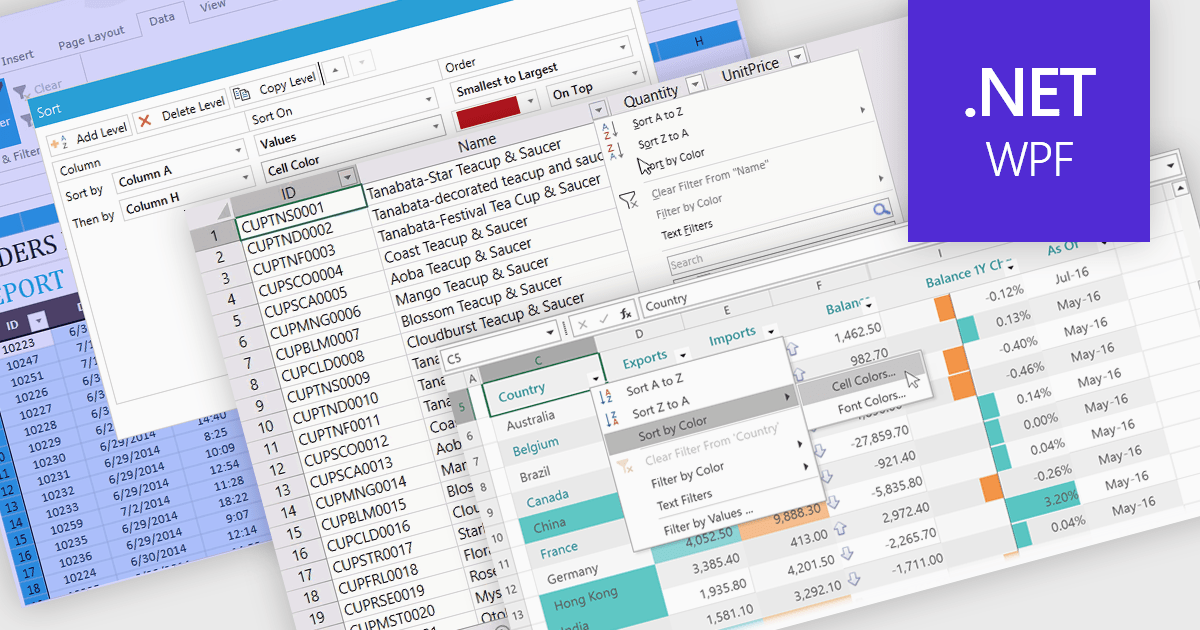
Data sorting in a spreadsheet control is a fundamental feature that enables users to rearrange data within a grid or table based on specific criteria, typically ascending or descending alphabetically or by numerical value. Sorting will usually be performed on single or multiple columns and is often integrated with other data manipulation tools like filtering, grouping, and searching. By sorting data, users can quickly locate and analyze information, identify patterns, and ensure consistency across records. Especially useful in large datasets, it improves the readability of the information and makes it more organized in preparation for decision-making, reporting, and data validation. This capability facilitates efficient data analysis, and supports better user interaction by allowing datasets to be viewed in meaningful sequences.
Several WPF spreadsheet controls offer support for data sorting including:
For an in-depth analysis of features and price, visit our WPF spreadsheet controls comparison.


Tel: (888) 850 9911
Fax: +1 770 250 6199


