


Official Supplier
As official and authorized distributors, we supply you with legitimate licenses directly from 200+ software publishers.
See all our Brands.
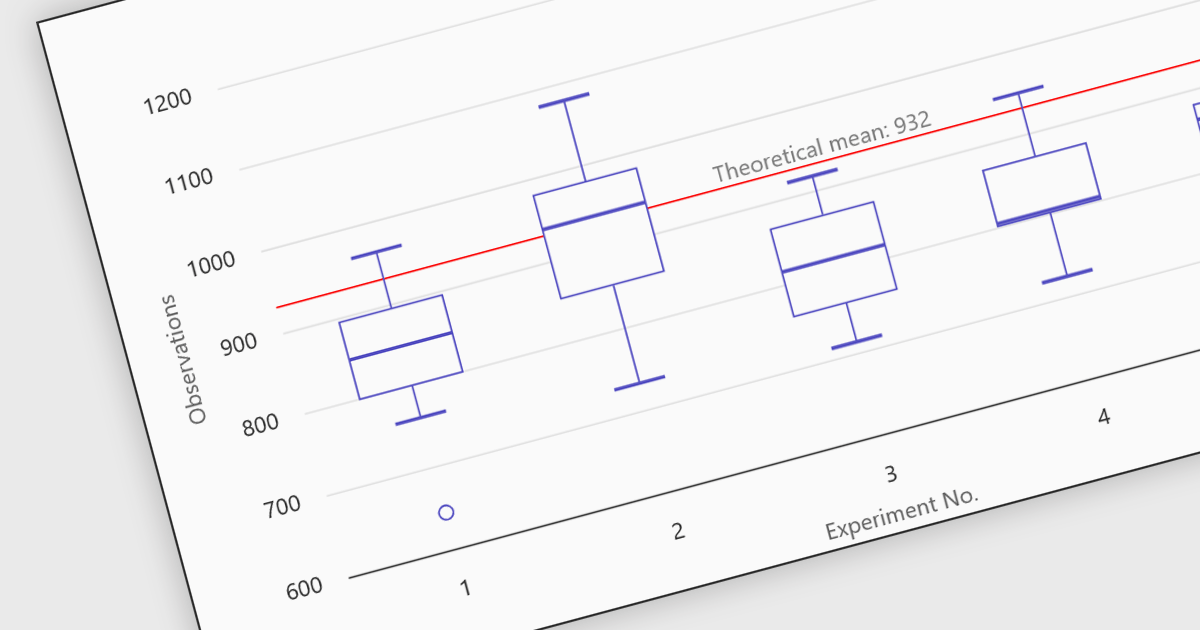
Box plots in React chart controls are statistical visualizations used to present the distribution of a dataset by highlighting key summary values, including the minimum, first quartile (Q1), median, third quartile (Q3), and maximum. In React applications, chart components render this information as a rectangular box representing the interquartile range, with lines known as whiskers extending to the minimum and maximum values, and optional markers indicating outliers. This visualization allows developers and analysts to quickly understand data spread, central tendency, and variability within a dataset. Box plots are commonly used in analytical dashboards, financial analysis tools, and scientific applications built with React, where comparing distributions and identifying anomalies across multiple data groups is important.
Many React chart controls support box plots including:
For an in-depth analysis of features and price, visit our comparison of React chart controls.
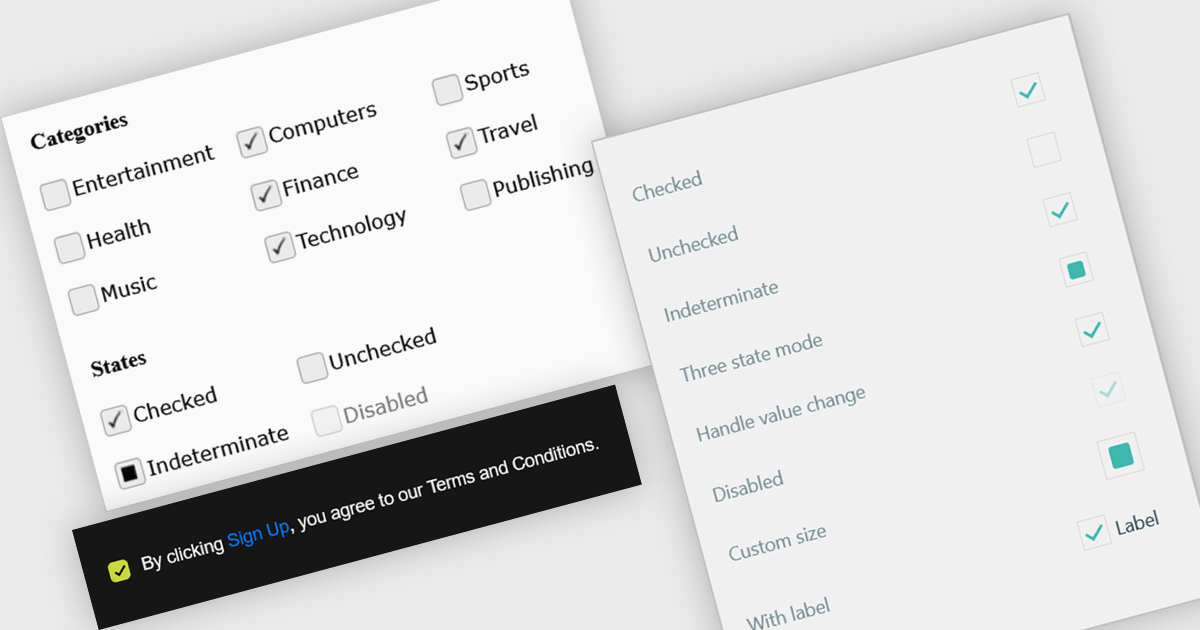
A check box is a user interface element that represents a Boolean field, allowing users to toggle between two states such as true and false directly within a form or data grid. It provides a clear and efficient way to edit logical values without requiring manual text input, reducing the risk of invalid entries and improving data consistency. For software developers, integrating check boxes into data-bound controls simplifies validation logic, and ensures that binary options are presented in a predictable and accessible format across applications.
Several React data editor collections provide check box editing capabilities including:
For an in-depth analysis of features and price, visit our comparison of React Data Editor components.
DevCraft by Telerik is a comprehensive AI-powered suite of more than 1,250 UI components and development tools designed for building modern web, desktop, and mobile applications using .NET and JavaScript frameworks. It includes reporting and report management solutions, automated testing and mocking tools, and document processing libraries, as well as a wide range of professionally designed user interface controls from the Telerik and Kendo UI suites. DevCraft enables developers to create feature-rich, high-performance applications with consistent design and user experience, delivering enterprise-level, scalable, and maintainable software solutions.
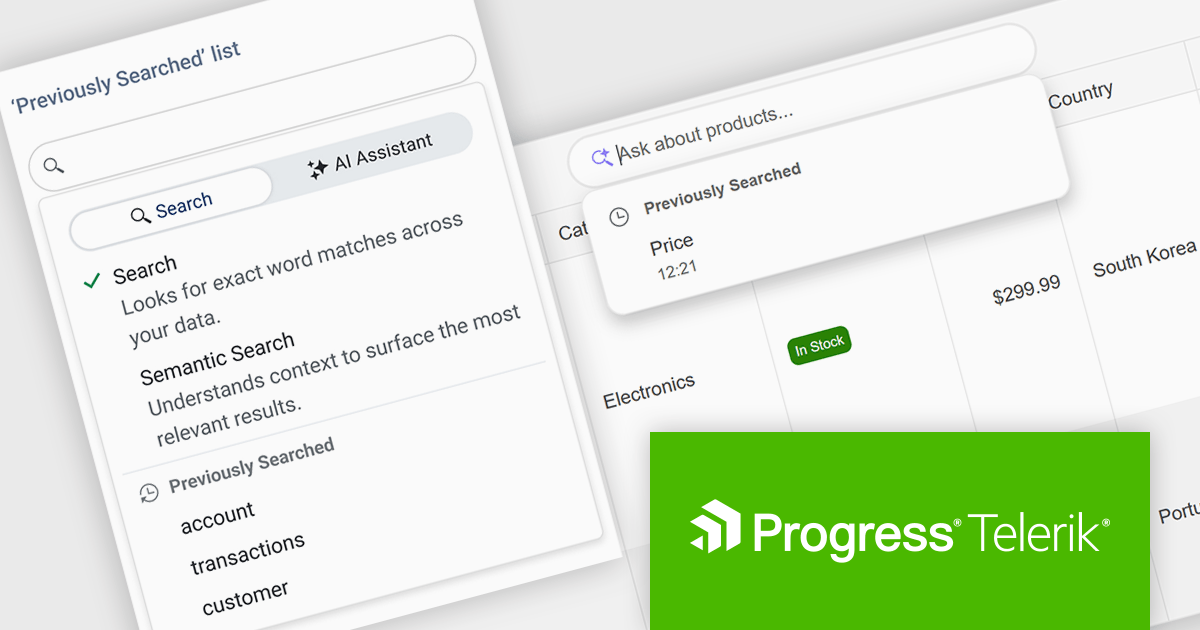
The Telerik DevCraft 2026 Q1 update adds Semantic Search through a new unified SmartBox, making it easier for developers to build natural language search directly into the DataGrid. Instead of depending on exact keyword matches, the feature uses artificial intelligence (AI) to understand meaning and context. It can return relevant results across multiple columns and related fields, even if the user’s search terms do not exactly match the stored data. The SmartBox brings semantic search, filtering, and follow-up query refinement together in one interface. This reduces the need to write and maintain custom search logic, while making integration more straightforward. As a result, applications can deliver more accurate search results, help users find information faster, and make large or complex datasets easier to explore.
To see a full list of what's new in DevCraft 2026 Q1, see our release notes.
Telerik DevCraft is licensed per developer and has two licensing models: an annual Subscription License and a Perpetual License. The Subscription license provides access to the latest product updates, technical support, and exclusive benefits for a flat annual fee, and must be renewed to continue using the software. The Perpetual license is a one-time purchase granting access to the current released version and includes a one-year subscription for product updates and technical support. After this initial period, users can choose to renew the subscription element to continue receiving updates and support; otherwise, they may continue using the installed version available during their active subscription term but will forgo future updates and support. See our Telerik DevCraft Ultimate licensing page for full details.
For more information, see our product pages:
DevCraft by Telerik is a comprehensive AI-powered suite of more than 1,250 UI components and development tools designed for building modern web, desktop, and mobile applications using .NET and JavaScript frameworks. It includes reporting and report management solutions, automated testing and mocking tools, and document processing libraries, as well as a wide range of professionally designed user interface controls from the Telerik and Kendo UI suites. DevCraft enables developers to create feature-rich, high-performance applications with consistent design and user experience, delivering enterprise-level, scalable, and maintainable software solutions.
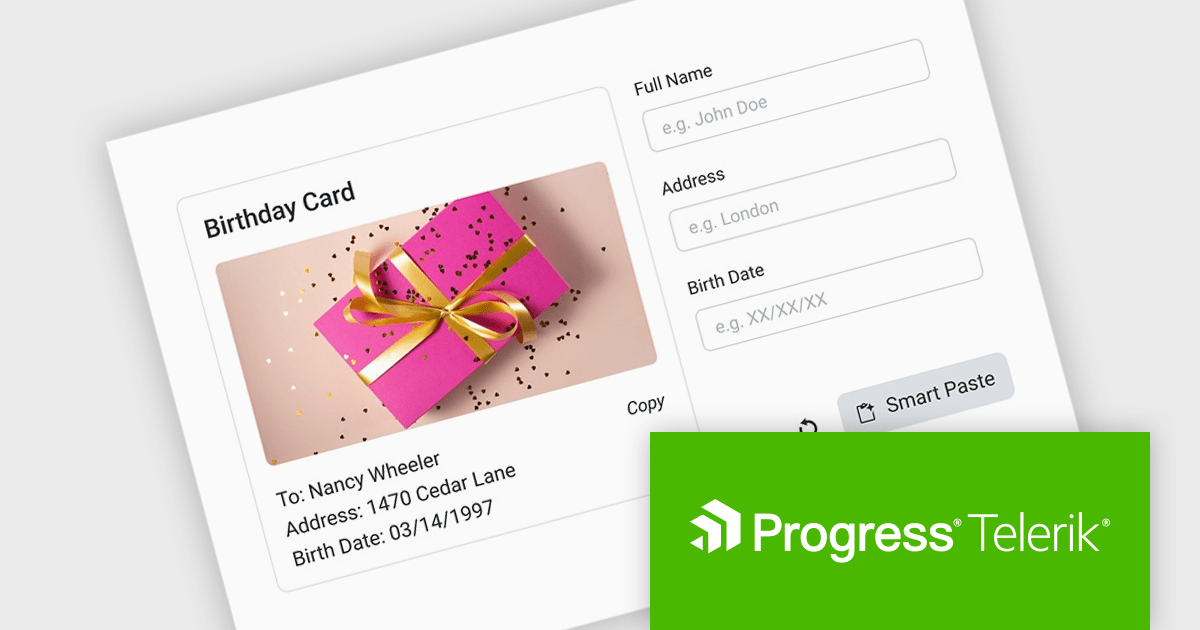
The Telerik DevCraft 2026 Q1 update introduces an AI-powered Smart Paste component that turns unstructured text into ready-to-use form data instantly by extracting structured information from clipboard content and automatically populating the appropriate fields. Instead of requiring users to manually copy and paste data into multiple inputs, the SmartPasteButton sends pasted text from emails, documents, or other sources to an AI endpoint that interprets the content and returns mapped field values for the form. This improves data entry, reduces repetitive input, and improves accuracy, enabling developers to deliver more efficient, intelligent form experiences within their applications.
To see a full list of what's new in DevCraft 2026 Q1, see our release notes.
Telerik DevCraft is licensed per developer and has two licensing models: an annual Subscription License and a Perpetual License. The Subscription license provides access to the latest product updates, technical support, and exclusive benefits for a flat annual fee, and must be renewed to continue using the software. The Perpetual license is a one-time purchase granting access to the current released version and includes a one-year subscription for product updates and technical support. After this initial period, users can choose to renew the subscription element to continue receiving updates and support; otherwise, they may continue using the installed version available during their active subscription term but will forgo future updates and support. See our Telerik DevCraft Ultimate licensing page for full details.
For more information, see our product pages:
ONLYOFFICE Docs is a comprehensive online editor, allowing users to create text documents, spreadsheets, presentations, and forms. It enables your users to edit, share, and collaborate on documents online in their preferred browser, within your own application. It is fully compatible with OOXML (Office Open XML) formats and supports popular Microsoft Office and other document formats such as CSV, DOC, DOCX, EPUB, HTML, ODP, ODS, ODT, PDF, PPT, PPTX, RTF, TXT, XLS, and XLSX.
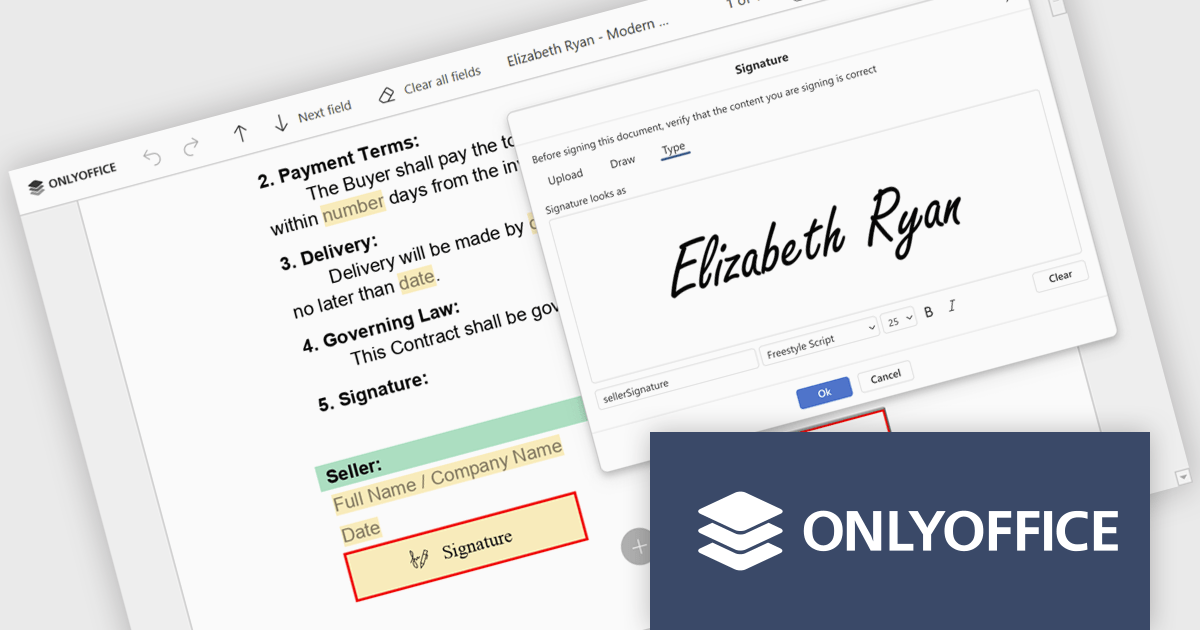
The ONLYOFFICE Docs v9.3 update includes an improved PDF Forms signature field which now allows users to draw their signature directly on screen using a mouse or touch-enabled device. This option provides a more personal and natural signing experience, particularly in scenarios where uploading an image or typing a name is not practical. By supporting freehand input within the form itself, it helps maintain document authenticity while keeping the signing process intuitive and accessible across devices.
To see a full list of what's new in v9.3, see our release notes.
ONLYOFFICE Docs Developer Edition is licensed by the number of simultaneous document connections and is available as an annual license with 1 year support and upgrades. See our ONLYOFFICE Docs Developer Edition licensing page for full details.
For more information, see our ONLYOFFICE Docs Developer Edition product page.


Tel: (888) 850 9911
Fax: +1 770 250 6199


