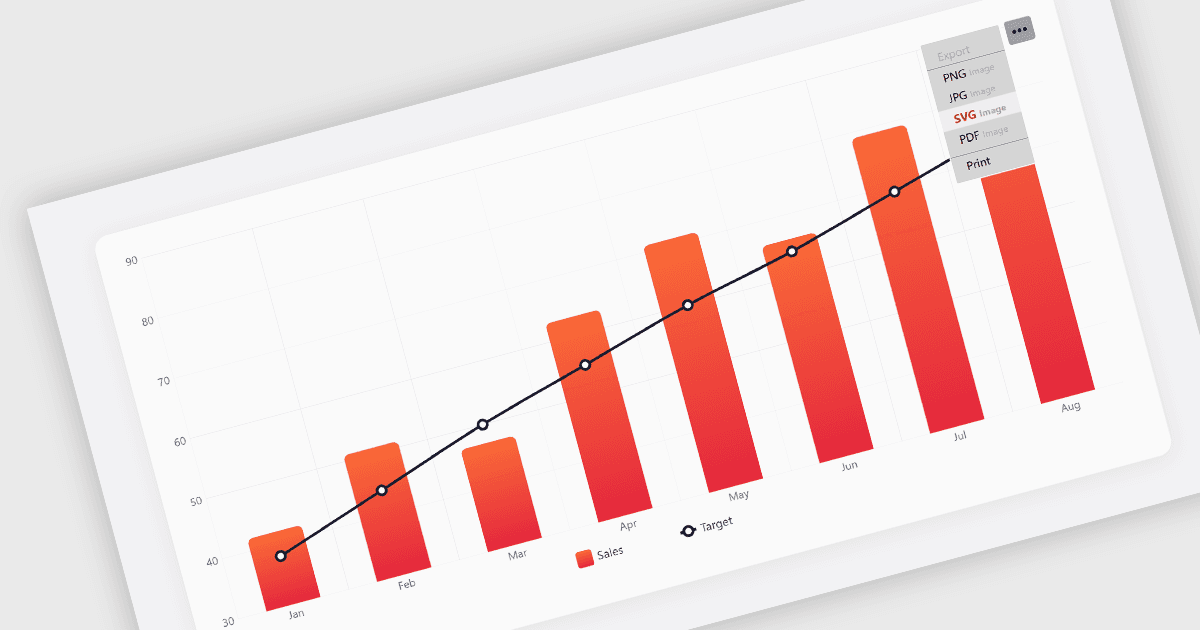
Export Charts to SVG in JavaScript
amCharts 5.21 adds SVG rendering and export, supporting data visualization with scalable, editable output for reports, presentations and design tools.
Create interactive, customizable maps with flexible projection support.

Prices from:
| Available individually | Our Price |
|---|---|
| amCharts 5: Maps | Loading |
Trial version available Contact us for a free trial

Leverages the open GeoJSON standard for maps, ensuring compatibility and ease of use. Developers can access hundreds of high- and low-detail maps covering countries, regions, and subregions, facilitating precise geographic representations.
Includes MapPolygonSeries for areas, MapLineSeries for lines, MapPointSeries for markers, and GraticuleSeries for grids. This modular approach allows flexible layering and customization of map features.
Supports a variety of built-in cartographic projections, including Mercator, Albers USA, Equal Earth, and Orthographic, as well as external D3 projections. This enables developers to display maps in different visual forms for specific analytical needs.
Provides configurable panning modes, including endless horizontal rotation, and multiple zooming options via controls, mouse wheel, and touch gestures, enhancing user interaction with the map.
Allows precise control over map centering by adjusting rotation on X, Y, and Z axes. This feature enables focusing on specific geographic areas and custom map orientations.
Includes support for heat rules, enabling choropleth-style maps where geographic areas can be colored dynamically based on data values for insightful visual analysis.
Facilitates combining multiple map series for layered geographic presentations, such as adding regional subdivisions on world maps, with easy inclusion or exclusion of specific areas.
Supports adding customizable backgrounds, like water fills behind landmasses, enhancing the aesthetic appeal and clarity of maps.
Offers an optional integrated zoom control with buttons, simplifying map navigation for end users and improving usability.
Review the details below to ensure this product is supported within your environment.
amCharts 5.21 adds SVG rendering and export, supporting data visualization with scalable, editable output for reports, presentations and design tools.
amCharts, founded in 2006, is a leading creator of JavaScript charting libraries based in Lithuania. Its main library, amCharts 5, is actively developed and widely integrated with TypeScript, React, Angular, Vue, and plain JavaScript environments. amCharts libraries allow developers to build modern, customizable, and high-performance data visualizations including charts, maps, and infographics. With a focus on efficient rendering using the Canvas API, accessibility, and flexible theming, amCharts offers straightforward licensing and architecture that supports diverse visualization needs for web dashboards and interactive analytics.

As official and authorized distributors since 2019, ComponentSource supplies you with legitimate licenses directly from amCharts.