AnyChart JS
JavaScript charts designed to be embedded and integrated.
Published by AnyChart
Distributed by ComponentSource since 2017
Prices from: $ 136.22 Version: 8.12.1 NEW Updated: Apr 11, 2024
AnyChart JS supports dozens of chart types, 2D and 3D, single-series and multi-series. From the most common bar, line, area, donut and stacked charts to funnel, OHLC, treemap, scatter, polar, Venn, waterfall and other charts and diagrams as well as linear and circular gauges, tag clouds and more.

Image 1 / 5
The data engine is very flexible and includes several data models for different chart types for the purpose of being as robust and convenient to use as possible.
The Data Sets mechanism allows you to solve a number of tasks, like being able to plug in data from external CSV or JSON formatted sources without having to adapt the format, or being able to show different or same columns from the raw data source in different ways. Data streaming is available as AnyChart JS gives you the ability to create, read, update and delete data in real-time without full reloading and redrawing - charts can be changed fast and in a flexible manner.

Image 1 / 5
Choose any server platform and browser as AnyChart JS does not need PHP, ASP or .NET and does not require jQuery, other JS libraries or client-side plugins such as Flash, Java or Silverlight. It can be used to visualize data from any data source: text files, Excel, CSV, MySQL, MS SQL, Oracle or any other databases.

Image 1 / 5
Although AnyChart JS supplies many chart types and features out of the box, any part of a chart can be changed and customized. Quickly configure and modify charts via JavaScript API, XML or JSON. Use one of many available chart design themes (based on multiple color palettes) or create your own unique viewing experience and apply it to multiple charts at once.

Image 1 / 5
Control the appearance of elements by adding interactive features, including tooltips, multi-selection, hover, multi-level drill-downs, keeping and excluding data points, and so on. Assign specific reactions to certain events via event listeners, simple JavaScript functions which are very easy to understand and use - any chart element can respond to user actions.

Image 1 / 5
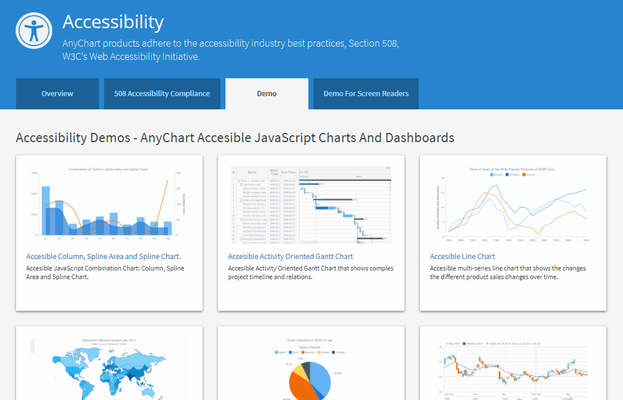
Charts powered by AnyChart JS are accessible to everyone. AnyChart adheres to the accessibility industry best practices, Section 508, W3C's Web Accessibility Initiative.


AnyChart JS supports all browsers, including IE6+ along with mobile browsers.

Image 1 / 5
AnyChart JS provides you with ability to export charts to images (SVG, PNG, JPG), PDF or data files (CSV, Excel). These options are available both via Context menu and API. Every export has fine tune options, including an ability to change file name. There is also a special option to save chart configuration which may be used to debug charts and report issues.

Image 1 / 3
Building international or multi-language solution? No problems. AnyChart JS provides 190+ predefined locale files, and you can build your own as well.

Image 1 / 2
JavaScript charts built with AnyCharts JS can be easily be used on a single, effective, interactive HTML5 dashboard. Multiple complex dashboard samples are available and ready-to-use, allowing you to implement industry-standard visualizations in minutes.

Image 1 / 5