LightningChart .NET
High-performance Charts and Graphs for WPF, WinForms and UWP.
Published by LightningChart
Distributed by ComponentSource since 2021
Prices from: $ 1,347.50 Version: v12.2.1 NEW Updated: Mar 26, 2025
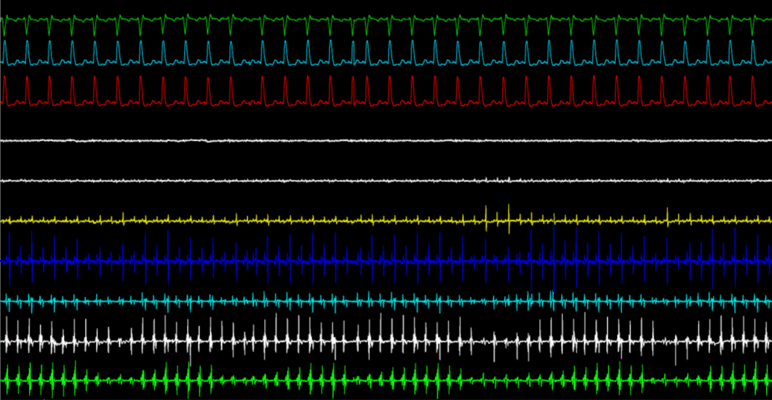
A new series fully optimized for real-time applications. It offers the best possible performance with the least CPU and memory consumption, allowing the rendering of an extremely high number of data points simultaneously.
SampleDataBlockSeries is the optimal series type for real-time medical monitoring applications, such as ECG/EKG, EEG, industrial monitoring applications, telemetry, and waveform vibration monitoring.

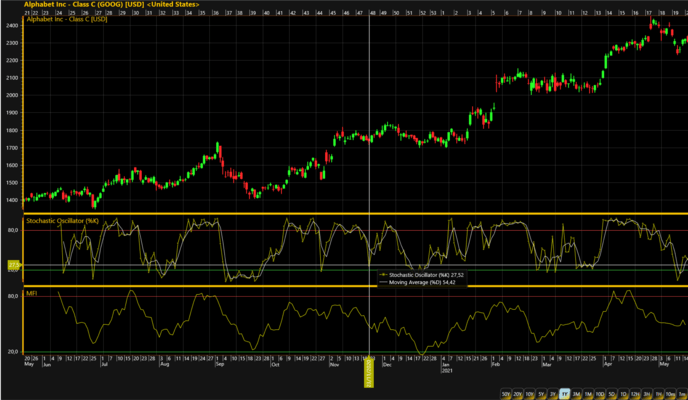
Stochastic Oscillator and Money Flow Index are new technical indicators available for Trading Charts. Suitable for the development of real-time financial analytics app, both Stochastic Oscillator and Money Flow Index support data from MarketStack data provider which allows the update of real-time financial data minute by minute.

The World's fastest .NET chart with unbeatable performance increases its rendering performance to 16 billion data points in real-time using a mid-level desktop PC.

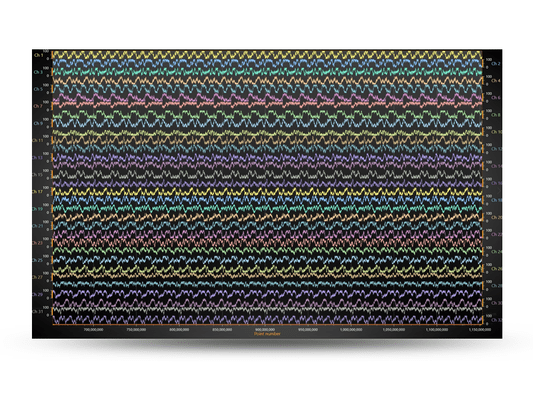
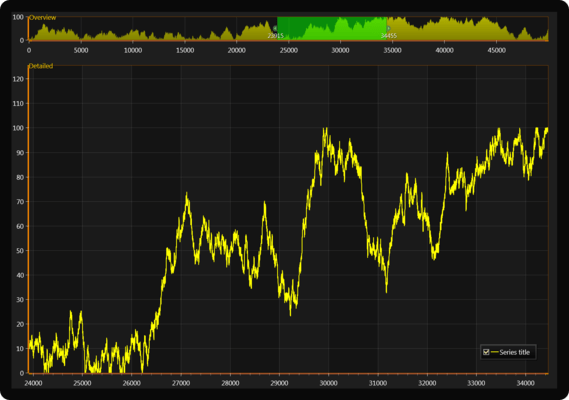
Visualize your complex and huge data sets, with the optimized series types, shared X axes, built-in real-time scrolling modes and industry leading configuration options.

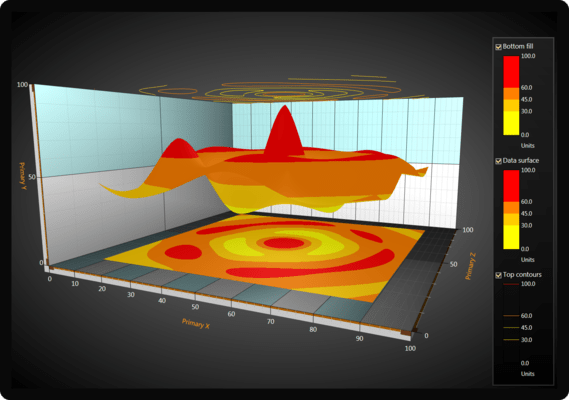
Get 3D charts for WPF and Winforms.

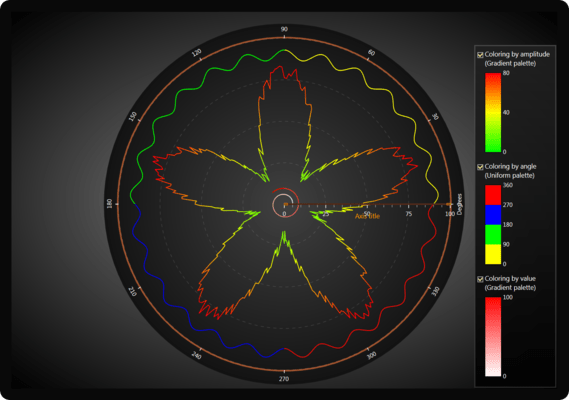
ViewPolar allows data visualization in a polar format. The data point position is determined by angular value and amplitude. Polar view also has versatile zooming and panning features.

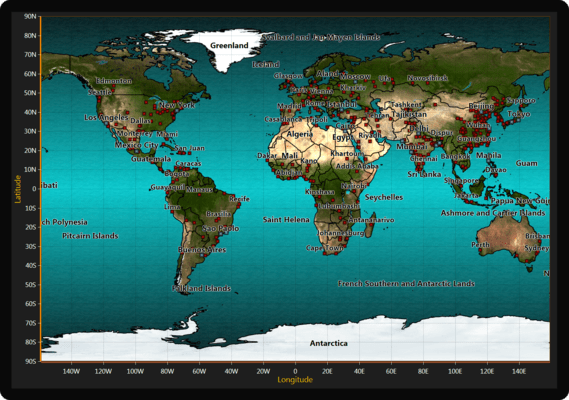
The maps are visualized in ViewXY, and allows combining e.g. routes, heatmaps, or arrows in the same visualization. The maps use equirectangular projection.

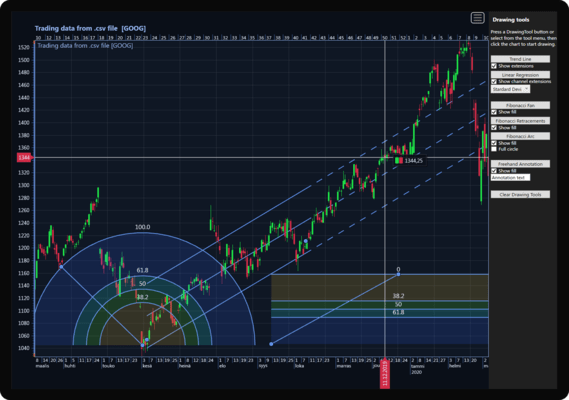
Easy-to-use, easy-to-integrate, trading charts with basic Technical Indicators and Drawing Tools. The easiest approach for making apps for Trading and Technical Analysis.

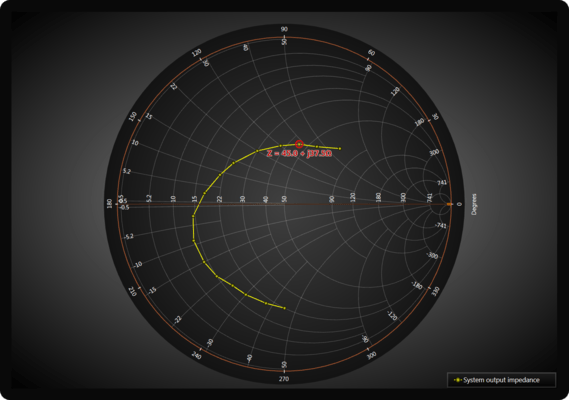
Smith Charts allow simultaneous visualization of multiple parameters, like impedance, admittance, reflection coefficients scattering parameters and so on.

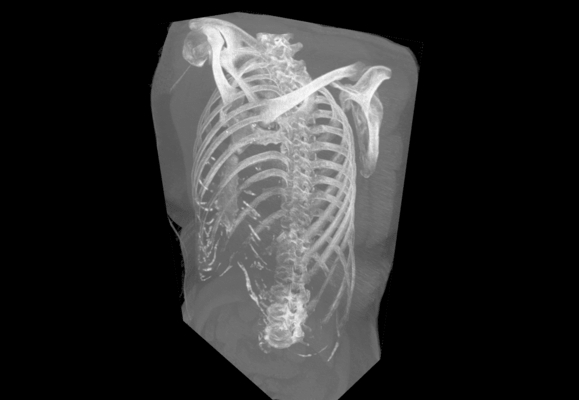
Volumetric information plays an essential role in medicine, e.g. for an advanced cancer detection, visualization of aneurysms, and treatment planning. It is also used for non-destructive material testing via computer tomography or ultrasound. In addition, huge three-dimensional datasets are produced by geo seismic research, and can also be visualized by our Volume Rendering engine.

