Highlight Trends in Grid Data with Sparklines
February 26, 2024Product Update
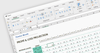
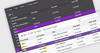
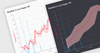
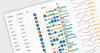
jQWidgets v19 lets you integrate sparklines into your grids, providing a quick and insightful way to visualize trends and patterns in your data.
Tel: (888) 850 9911
Fax: +1 770 250 6199