Present Complex Data in a Clear and Organized Way
April 4, 2024Product Update
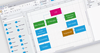
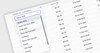
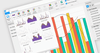
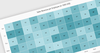
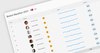
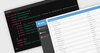
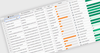
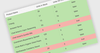
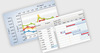
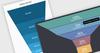
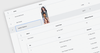
Infragistics Ignite UI for Blazor 23.2.189 adds a new hierarchical data grid which helps users find the information they need more quickly.
Tel: (888) 850 9911
Fax: +1 770 250 6199