Equip React Grid Apps with PDF Export Functionality
July 15, 2024Feature Highlight
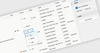
Easily distribute and view grid data by exporting it to a PDF directly from your React application, whilst retaining its original layout and formatting.