Provide a Visual Depiction of Complex Data Flows
October 16, 2024Feature Highlight
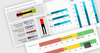
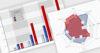
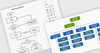
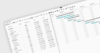
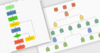
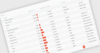
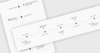
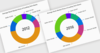
Vue.js diagrams enable users to visually map data, and state changes, providing a clear overview of how elements connect.
Tel: (888) 850 9911
Fax: +1 770 250 6199