Create Charting Apps with Enhanced Accessibility
September 20, 2024Product Update
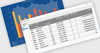
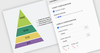
ZingChart 2.9.15 adds new keyboard navigation and speech support, empowering users of all abilities to explore, analyze and understand data.
Tel: (888) 850 9911
Fax: +1 770 250 6199