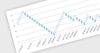
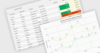
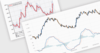
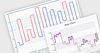
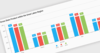
Data Visualization Components News

RSS Feed

Visualize Complex Hierarchical Data Structures

May 14, 2024Product Update
LightningChart JS v5.2.0 adds Treemap charts, giving JavaScript developers the ability to display hierarchical information as nested rectangles.

Add Data-Virtualized Paging to WinForms Datagrids

May 14, 2024Feature Highlight
ComponentOne WinForms datagrid offers paging to optimize performance for large datasets with on-demand data loading.

Enhance Data Comprehension with Sparklines

May 13, 2024Product Update
Smart HTML Elements v19 adds sparkline support to help users quickly understand patterns in their data without the need for separate charts.

Emphasize Specific Sections of a Funnel Chart

May 7, 2024Product Update
Infragistics Ultimate UI for Windows Forms and WPF gain a new overlay feature to help users identify areas that deviate from the overall trend.

Uncover Patterns with Circular Visualizations

May 2, 2024Feature Highlight
Enhance your WPF app's data visualization with Radar and Polar charts, ideal for effectively portraying multivariate data.

Export Grid Data to CSV for Analysis and Processing

May 1, 2024Feature Highlight
Efficiently transform your tabular data into actionable insights with a grid control that offers seamless CSV export functionality.

Navigate Seamlessly Between Cells Within Selections

April 26, 2024Product Update
Handsontable 14.3 allows experienced grid users to quickly move between specific cells within a selection using keyboard shortcuts.

Export Charts to Image Formats with ASP.NET Core

April 25, 2024Feature Highlight
Provide flexibility for users by giving your applications the ability to export charts to image formats such as PNG, JPG and more.

Reduce Visual Clutter in Your Grids

April 24, 2024Feature Highlight
Hiding columns allows users to customize their grid view by temporarily removing irrelevant data for more efficient analysis.

Enhance Sharing Efficiency with SVG Chart Export

April 22, 2024Feature Highlight
The Scalable Vector Graphics format provides a flexible way to share charts that scale without quality loss and offer significantly smaller file sizes.

Rapidly Create Excel Spreadsheets with Templates

April 19, 2024Product Update
Document Solutions for Excel v7.1 features refactored DsExcel templates to improve performance, stability, and handle a wider range of user needs.

Effectively Visualize Proportional Data in Blazor

April 18, 2024Feature Highlight
Pie charts allow users to see the relative sizes of different categories in a data set, offering a clear view of the whole set and its constituent parts.

Let Grid Users Input Non-Latin Characters

April 17, 2024Feature Highlight
Grid controls with Input Method Editor (IME) support allow users to generate characters that are not natively available on their input devices.

Visualize Geographic Data in Blazor Apps

April 17, 2024Feature Highlight
Harness the power of clear location-based information with interactive map components to inform and empower your users.

Build and Customize Your own Dashboard Layout

April 15, 2024Product Update
Highcharts Dashboards 2.0 enhances design flexibility through new CSS styling and custom layout options for a more tailored user experience.

Visualize Key Data in Your React Apps

April 12, 2024Feature Highlight
Gauge controls offer a clear and intuitive method to display metrics such as speed or progress, typically using linear or radial layouts.

Focus on Specific Data Subsets for Easier Analysis

April 11, 2024Feature Highlight
Filtering empowers data grid users to rapidly zoom in on relevant data to spot trends and uncover insights.

Undo and Redo Changes in Gantt Charts

April 10, 2024Product Update
Syncfusion Essential Studio ASP.NET Core 2024 Volume 1 lets you revert and reapply changes in the Gantt chart, making it easier to fix errors.

Let Users Focus on Specific Sections of Chart Data

April 9, 2024Feature Highlight
Zooming offers chart developers a way to enhance data analysis allowing users to examine trends, outliers, or details within the chosen data subset.

Visualize and Interpret Complex Data in jQuery

April 8, 2024Feature Highlight
Adding heatmaps or treemaps to your jQuery app fosters improved decision-making by displaying data in an engaging and intuitive manner.