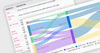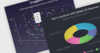
Illuminate Your Data with Treemap Highlighting
August 15, 2024Product Update
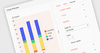
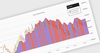
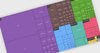
Infragistics Ignite UI for Blazor 24.1 enhances user engagement and data clarity with customizable mouse-over effects for treemaps.
Tel: (888) 850 9911
Fax: +1 770 250 6199