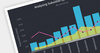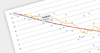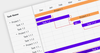
Easily Zoom Selected Chart Areas
December 20, 2023Product Update
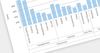
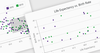
DevExpress Blazor 23.2 lets users home in on areas of interest in your charts with a click and drag gesture, allowing deeper analysis.
Tel: (888) 850 9911
Fax: +1 770 250 6199