LightningChart JS Features

Supported XY charts include: Line, Point, PointLine, Step, Spline, Area, AreaRange, Rectangle, Segment and OHLC.
XY Charts
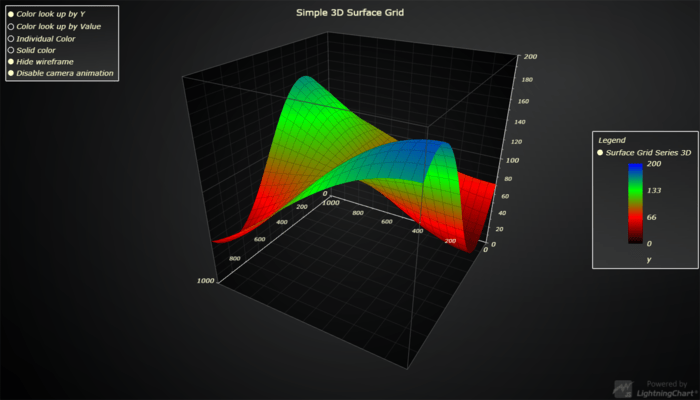
Supported 3D charts include: Line, Point, PointLine, PointCloud, Box and Surface series.
Advanced 3D Charts
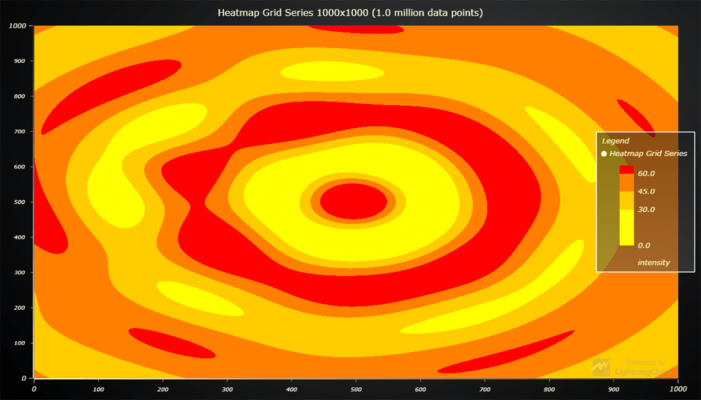
HeatmapGridSeries visualizes three-dimensional data (X, Y, color) of large quantities.
Heatmaps
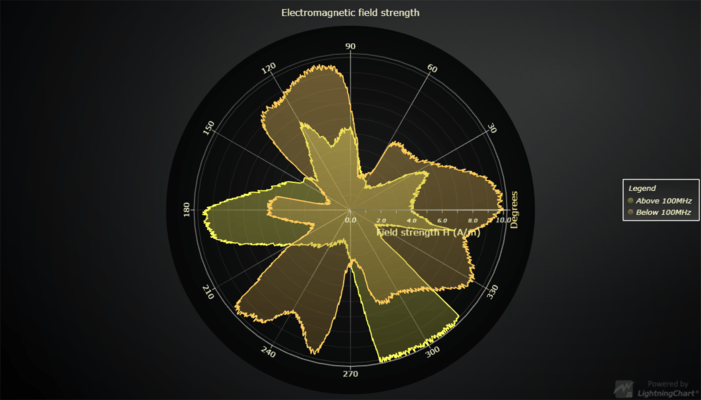
Display data in a Polar format.
Polar Charts
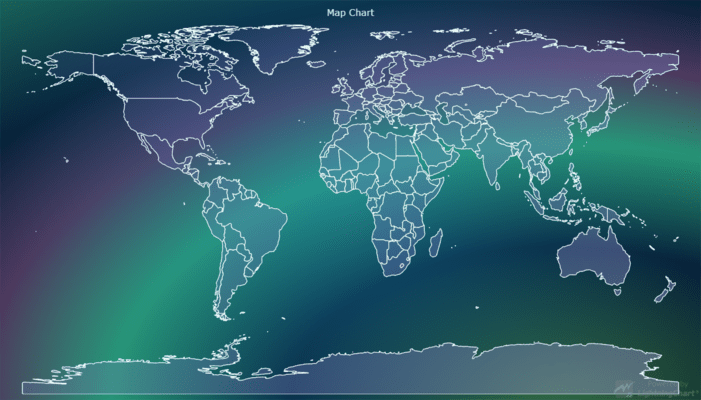
Show data using geographical representations.
Map Charts
Supported XY charts include: Line, Point, PointLine, Step, Spline, Area, AreaRange, Rectangle, Segment and OHLC.

Supported XY charts include: Line, Point, PointLine, Step, Spline, Area, AreaRange, Rectangle, Segment and OHLC.

The Candlestick chart is used as a trading tool to visualize price movements. A candlestick figure can represent multiple recorded values, which are packed into 4 values (open, high, low and close). This makes it useful for dynamically displaying data from longer intervals as well as shorter. XY Charts feature:

  • Series types: Line and point series, area series, area range series, OHLC series, rectangles, ellipses, box-whisker and line segment series.
  • Linear axes can be placed left/right/top/bottom and possibility to have several X and Y axes per chart.
  • Scaling modes include fitting, Expansion, Progressive/ Regressive and Manual.
  • Markers and data cursors have customizable shape and styles.
  • Logarithmic Axes
    • Can be used with Numeric TickStrategies as well as DateTime TickStrategies.
    • Base number can be set per Axis by users.
    • Available with XY charts, supported series types: Line, Point, PointLine, Step, Spline, Area, AreaRange, Rectangle, Segment and OHLC.
Supported 3D charts include: Line, Point, PointLine, PointCloud, Box and Surface series.

Supported 3D charts include: Line, Point, PointLine, PointCloud, Box and Surface series.

JavaScript 3D Charts features:

  • Series types: Line series, Point series, PointLine series, PointCloud series, Box series, Surface series.
  • Customize the shape of the Bounding Box of the 3D Chart.
  • Linear Axes for X, Y and Z planes around Bounding Box of the 3D Chart.
  • Use Numeric and DateTime format with Axis ticks.
  • Camera can be controlled to rotate around and zoom in / out of the Chart area.
  • 3D box series
    • Customizable with value based coloring, solid coloring for all boxes, individual box colors, and the roundness of the Box Shape edges.
    • Supports dynamic coloring by x, y or z coordinates.
  • 3D surface series
    • Customizable with: value based coloring, solid coloring, Data-Point based coloring.
    • Comes with customizable wireframe.
HeatmapGridSeries visualizes three-dimensional data (X, Y, color) of large quantities.

HeatmapGridSeries visualizes three-dimensional data (X, Y, color) of large quantities.

Heatmaps can easily handle data sets in million data points range even on low-end devices. With large amounts of RAM even billions of data points can be visualized.

  • Usable in XY Charts.
  • Create a 2D rectangular heatmap using the IntensityGrid option.
  • Create a 2D mesh Heatmap using the IntensityMesh option.
  • Use Heatmaps to create Spectrograms.
Display data in a Polar format.

Display data in a Polar format.

Visualize data in a Polar coordinate system (angle + amplitude).

  • Series Types (all stylable with familiar API): Line series, Point series, PointLine series, Polygon series and Area series.
  • Polar Sectors (easily stylable with familiar API). Highlight a section of the Polar Chart with ease.
  • Can be rotated via API.
  • AutoCursor is available for Polar Charts.
  • Can be used as a stand-alone Chart, or in a Dashboard.
Show data using geographical representations.

Show data using geographical representations.

MapChart supports 9 different map types, each of which depicts a different part of the world.

  • Can be used as a stand-alone Chart component or placed inside a Dashboard.
  • Supports following views: World, USA, North America, South America, Canada, Europe, Asia, Africa and Australia.
  • Supports Auto Cursor feature for displaying region data with mouse.
  • Can be colored with solid color for entire map, or with dynamic color per region.
  • Supports LUT UI element for visualizing dynamic color table.
  • Supports real-time updates.