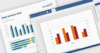
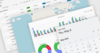
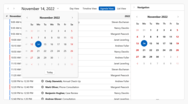
Data visualization components implement the functionality to view data in tables or data grids, as simple charts or complex graphs and enables you to create sophisticated management dashboards using gauges, maps and flowcharts.
Advanced data visualization for more informative reports.
Nevron Gauge for SSRS - Delivers a complete set of gauge types, highly customizable axes, tight data integration and unmatched visual effects to your reports. It includes linear gauges, state indicators and numeric displays.
Add interactive charts and maps to your apps and websites.
Responsive Stock Charts - Highcharts Stock's responsiveness goes beyond simply fitting the chart to the dimensions of its container. It also automatically finds an optimal placement for non-graph elements such as legends and headings.
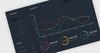
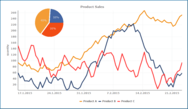
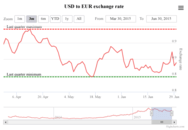
Create stock or general timeline charts for your Web and mobile apps.
Stock and Timeline Charts - Highcharts Stock provides a wide range of dynamic, responsive stock chart types and timelines which can be used to visualize the most complex data in an understandable, user-friendly format.
Includes over 600 UI Controls, DevExpress Dashboard, eXpressApp Framework and more.
JavaScript Charting - A collection of 30+ responsive charts that enable you to transform data into an eye-catching and elegant visual representation. Includes line, area, bar, pie, funnel, pyramid, financial, range, and polar charts.
.
High-performance toolkits for your development projects.
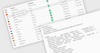
WinUI DataGrid - Used for efficiently displaying and manipulating tabular data, its rich feature set includes data binding, editing, sorting, filtering, grouping and data virtualization. It has been optimized for working with millions of records, as well as handling high-frequency, real-time updates.
Sleek UI and tools for .NET and JavaScript technologies.
120+ WinForms UI Controls - Telerik DevCraft UI includes a wide array of WinForms contols including data management, data visualization, interactivity, document processing, editors, layout and navigation.
Award-winning .NET and JavaScript controls for mobile, Web and desktop.
Grid Column Menus - FlexGrid for Blazor now has built-in column menus to sort, filter, group and resize columns. Users can easily invoke the menu by clicking on the ellipses button beside the column name.
Data visualization components for desktop and Web applications.
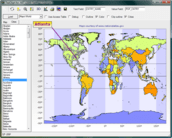
Nevron Gauge and Map for .NET - Suitable for any application that needs to visualize KPIs, scorecards or geographical data. The controls feature a full set of radial and linear gauges, LED displays, state indicators, and map projections.
JavaScript charts designed to be embedded and integrated.
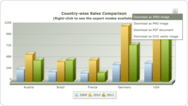
Wide Variety of Chart Types - AnyChart allows you to display 68 out-of-the-box chart types (Area, Bar, Bar Mekko, Box, Bubble, Bullet, Candlestick, Cherry, Circular, Column, Dot/Marker, Doughnut, etc.) and provides features to create your own.
.