Data visualization components implement the functionality to view data in tables or data grids, as simple charts or complex graphs and enables you to create sophisticated management dashboards using gauges, maps and flowcharts.
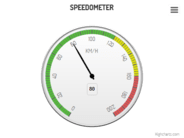
Advanced data visualization for more informative reports.
Nevron Gauge for SSRS - Delivers a complete set of gauge types, highly customizable axes, tight data integration and unmatched visual effects to your reports. It includes linear gauges, state indicators and numeric displays.
Add interactive charts and maps to your apps and websites.
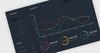
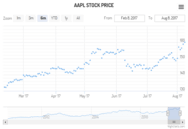
Responsive Stock Charts - Highcharts Stock's responsiveness goes beyond simply fitting the chart to the dimensions of its container. It also automatically finds an optimal placement for non-graph elements such as legends and headings.
Create stock or general timeline charts for your Web and mobile apps.
Stock and Timeline Charts - Highcharts Stock provides a wide range of dynamic, responsive stock chart types and timelines which can be used to visualize the most complex data in an understandable, user-friendly format.
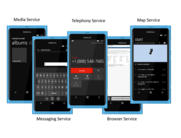
Code once in C# and XAML across native mobile devices.
FlexChart - Visualize your data in a wide range of charts, including bar, column, area, line, spline, scatter, bubble and candle. With animation and interactive features, FlexChart for Xamarin brings life to your mobile dashboards.
Add platform independent diagramming to your application.
Diagram Shapes - Over 100 predefined node shapes are available for you to choose from and you can also define your own. The connectors also provide a variety of customization options, they can be straight lines, curves, start and end with various arrowhead shapes, change color and position.
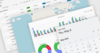
JavaScript data grid that looks and feels like a spreadsheet.
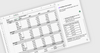
Created for Developers - Handsontable is easy to implement, flexible, and super customizable. You can extend it with custom plugins and edit the source code as required. Plus you get access to a comprehensive API, useful tutorials, and full commercial support.
High-performance toolkits for your development projects.
MAUI Controls - A comprehensive collection of .NET MAUI components for building modern mobile and desktop applications with C# and XAML. It includes charts, gauge, tab view and document processing libraries (Excel, PDF, Word, and PowerPoint).
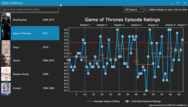
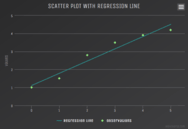
Create interactive JavaScript charts for Web, Mobile & Enterprise applications.
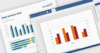
Chart Flexibility - FusionCharts gives you complete flexibility to customize the charts. You can centrally control the cosmetics of your charts like background color, plot colors, fonts etc. with the advanced theming engine.
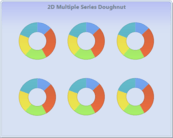
Easily Generate Rich Charts - Actipro Charts supports many chart types from basic line and bar charts to complex stacked area charts. It includes useful features such as multiple series, labels, legends, stacking, and customizable palettes.