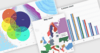
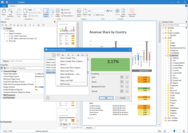
Data visualization components implement the functionality to view data in tables or data grids, as simple charts or complex graphs and enables you to create sophisticated management dashboards using gauges, maps and flowcharts.
Add interactive charts and maps to your apps and websites.
Map collection - Highcharts Maps includes a collection of maps, optimized for use with Highcharts Maps. For common maps, it saves you the trouble of finding or drawing suitable SVG or GeoJSON maps. Instead, you can choose between hundreds of pre-generated maps of countries, regions and other administration levels.
Advanced data visualization for more informative reports.
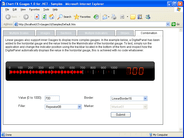
Nevron Gauge for SSRS - Delivers a complete set of gauge types, highly customizable axes, tight data integration and unmatched visual effects to your reports. It includes linear gauges, state indicators and numeric displays.
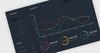
Stunning JavaScript charts for your website or Web application.
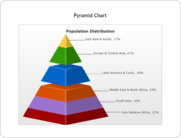
Chart Types for Every Need - Comes with an impressive array of chart types that provide beautifully rendered visuals. It also includes real-time charts that users can interact with, and extensive small chart support optimized for thousands of charts per page.
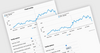
Create stock or general timeline charts for your Web and mobile apps.
Data Grouping - Group data into optional groups like days, weeks and months. Data grouping replaces a sequence of data points with one grouped point. The value of each grouped point is calculated from the original values of every point used.
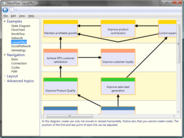
Add platform independent diagramming to your application.
Diagram Shapes - Over 100 predefined node shapes are available for you to choose from and you can also define your own. The connectors also provide a variety of customization options, they can be straight lines, curves, start and end with various arrowhead shapes, change color and position.
Create interactive JavaScript charts for Web, Mobile & Enterprise applications.
Works Everywhere - All charts work seamlessly across PCs, Macs, iPhones, iPads, and Android devices. All the charts are responsive to deliver the same experience everywhere.
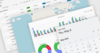
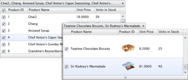
Deliver amazing user experiences on the WinForms platform.
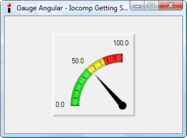
WinForms Chart Control - A comprehensive collection of 2D and 3D charts that have been optimized for performance and flexibility. The suite ships with 35+ 2D chart views and 20+ 3D views, from bars and pies to financial series.
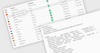
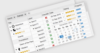
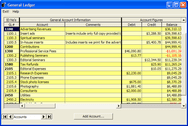
Build applications for Windows, Web, mobile and tablet.
WinExplorer HTML Templates - HTML-CSS templates allow you to override the default data presentation in all view styles. Use HTML markup to specify content for WinExplorer View items and use CSS code to customize the appearance, size, padding and layout of UI elements.