Data visualization components implement the functionality to view data in tables or data grids, as simple charts or complex graphs and enables you to create sophisticated management dashboards using gauges, maps and flowcharts.
Add interactive charts and maps to your apps and websites.
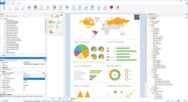
Map collection - Highcharts Maps includes a collection of maps, optimized for use with Highcharts Maps. For common maps, it saves you the trouble of finding or drawing suitable SVG or GeoJSON maps. Instead, you can choose between hundreds of pre-generated maps of countries, regions and other administration levels.
Advanced data visualization for more informative reports.
Nevron Chart for SSRS - Delivers a complete set of 2D and 3D chart types, customizable axes, data integration and visual effects to your reports. An indispensable tool for any Business Intelligence, scorecard or scientific report.
Blazor Components Library - 65+ UI and data visualization components including DataGrid (editing, grouping and Excel-like filtering), Charts (30+ charts and graphs ranging from line to financial charts) and Scheduler (display multiple calendars in a single layout with finely grouped events).
.
Adaptive UI for building Windows 10 apps with one code base.
UWP Gauge - The UWP Gauge control helps you build business dashboards or craft graphical indicators. It includes a rich assortment of circular, linear and numeric gauge types and offers powerful customization.
A comprehensive JavaScript charting library, with 40+ chart types.
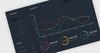
Interactive Zooming/Scrolling - Display tens of thousands of data points like stock quote comparison for a decade with a neatly-compressed macroscopic view. The user can easily and intuitively zoom into any subset of data.
High-performance toolkits for your development projects.
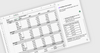
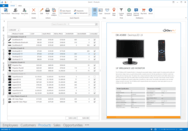
Powerful Data Grid - Data-bind to any data source, format data with a rich selection of cell types, and enable editing, sorting, filtering and grouping within a few minutes. Export to Excel and PDF formats.
Diagramming components for dependency visualization and analysis.
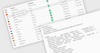
Stable Auto Layout - To prevent multi-parent hierarchy diagrams changing dramatically each time a node is added/removed, rules can be set for ordering nodes relative to each other. Because they are soft rules it does not enforce the layout so the control can still choose the optimal layout.
Stunning JavaScript charts for your website or Web application.
Chart Types for Every Need - Comes with an impressive array of chart types that provide beautifully rendered visuals. It also includes real-time charts that users can interact with, and extensive small chart support optimized for thousands of charts per page.
Includes over 600 UI Controls, DevExpress Dashboard, eXpressApp Framework and more.
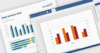
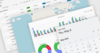
Data Visualization Widgets - JavaScript data visualization widgets allow you to transform data to its most concise and readable visual representation. All chart, gauge and range selector widgets can be composed into beautiful, informative dashboards that effectively convey intelligence at a single glance.