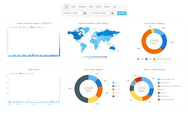
Data visualization components implement the functionality to view data in tables or data grids, as simple charts or complex graphs and enables you to create sophisticated management dashboards using gauges, maps and flowcharts.
Add interactive charts and maps to your apps and websites.
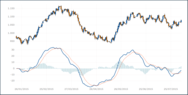
Responsive Stock Charts - Highcharts Stock's responsiveness goes beyond simply fitting the chart to the dimensions of its container. It also automatically finds an optimal placement for non-graph elements such as legends and headings.
Advanced data visualization for more informative reports.
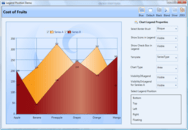
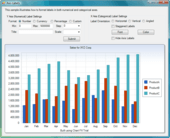
Nevron Chart for SSRS - Delivers a complete set of 2D and 3D chart types, customizable axes, data integration and visual effects to your reports. An indispensable tool for any Business Intelligence, scorecard or scientific report.
A pure JavaScript library for creating responsive, interactive charts for React apps.
Highcharts Gantt - Includes a robust JavaScript library that makes it easy for developers to build interactive charts for allocating, coordinating, and displaying tasks, events and resources along a timeline. It is customizable across a multitude of use-cases and across a multitude of platforms and clients.
Build responsive, interactive JavaScript data grids and tables.
CRUD Functionality - ZingGrid native CRUD functionality allows you to easily manipulate your data directly from the grid by adding a simple attribute. Start with basic editing capabilities and use the editor-controls attribute to enable visual controls for editing, adding, and deleting rows.
Stunning JavaScript charts for your website or Web application.
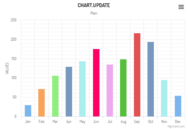
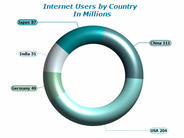
Chart Types for Every Need - Comes with an impressive array of chart types that provide beautifully rendered visuals. It also includes real-time charts that users can interact with, and extensive small chart support optimized for thousands of charts per page.
Build Web Forms apps for any browser and device in half the time.
Seamless UX Across Devices - Telerik UI for ASP.NET AJAX controls look and work flawlessly across all major browsers: Internet Explorer 6+, Chrome 2+, Firefox 3.6+, Safari 4+ and Opera 10+.
High-performance toolkits for your development projects.
MAUI Controls - A comprehensive collection of .NET MAUI components for building modern mobile and desktop applications with C# and XAML. It includes charts, gauge, tab view and document processing libraries (Excel, PDF, Word, and PowerPoint).
JavaScript data grid that looks and feels like a spreadsheet.
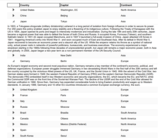
Filtering - You can filter data using a range of predefined conditions. The hidden rows are not rendered at all, which is good for overall table performance. The component is designed to handle hundreds of thousands of cells without delays or slowdowns.















 (23)
(23)




 (31)
(31)
 (5)
(5)